It is easy to Kill the Bird that Flies in a Straight Line.
The Art of Worldly Wisdom - Balthasar Gracian
I recently rediscovered a book I bought and first read about five years ago. While searching for a cable—of all things—I found this “pocket oracle” shoved in a box.
The Art of Worldly Wisdom by Baltasar Gracián is in the same vein as The Prince by Machiavelli and The Art of War by Sun Tzu.
It was interesting to go through what I had highlighted and annotated on my first read. One passage stood out:
#17 Keep changing your style of doing things. Vary your methods. This will confuse people, especially your rivals, and awaken their curiosity and attention. If you always act on your first intention, others will foresee it and thwart it. It is easy to kill a bird that flies in a straight line, but not one that changes its line of flight.
I reread this passage about two weeks ago, and it immediately came to mind while listening to a podcast.
In the last 15 minutes or so, Bob discusses Walk Forward Optimization. It’s well worth a listen, and I’m looking forward to part two.
What I took away from this is an addition to something I always highlight about price data: the old price data leaving a measurement period can have just as big an impact as today’s new price data being added.
As we move through 2024, I frequently update people on how Halloween 2023 data is shifting, like a pig moving through a python—slowly disappearing. At the time, it was the largest "blip" of volatility expansion to consider. These shifts matter a lot to us because they shape how we define “trend” in our system.
Bob introduces another shifting lookback approach, using two-year windows to optimize models.
Instead of relying on 20 years of data and overfitting to major historical events, most people today would say, “Survive the GFC, manage the low-vol 2010s, and not die in 2020.” But that approach risks overfitting for those specific scenarios.
Bob suggests a different method:
Use Year 1-2 data to trade in Year 3.
Recalibrate for Year 4 using Year 2-3 data.
We don’t lose Year 1 completely—it still plays a role in defining the system’s initial framework—but as we move forward, we adjust using newer data. This process continues year after year.
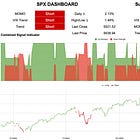
I’ve shared this chart with subscribers. You can look back at previous posts where I explain it in detail, but essentially, it highlights these 2-3 year cycles. The most recent of which may have ended, just as they did in 2018, 2020, and 2022.
This is not a doom-and-gloom post. I’m not predicting some massive crash.
What I am saying is that something may be shifting. The market could continue moving positively, but the swings might become more violent.
If the “trend” lines expand, as the previous chart suggests, we could simply see larger moves in both directions. Over the past two years, a 5% drawdown has caused panic and turmoil. Maybe now, the market is setting up for 10% drawdowns as the new normal.
To Bob’s point, maybe the “system” is currently optimized for 5% buy-the-dip opportunities, but we’re about to see more frequent 10% swings—just as the bird trained to fly in a straight line is caught off guard when it suddenly needs to dodge.
Models that have been trained—or, put another way, managers that have outperformed—have seen inflows to strategies that work best in smooth, straight lines.
I don’t claim to have a PhD in fortune telling, but maybe we should get more comfortable with wiggly lines.
Everyone talks about asset diversification—"Oh, I need exactly 7.3% allocation to this ETF." That’s a straight-line conversation.
If we want to be the bird that survives, maybe we should be talking just as much about system diversification.
New user guide - Paid Portfolio Posts
Hot Takes with Hank
The most recent weekly update
Intra-week Update


That's how I do it. The 3.5 Year Hurst cycle is well known and has worked for 50-60 years now out of sample. 3.5 years is peak to peak - so the actual peak to trough is obviously half of that. I mostly adjust my methods in a binary fashion - going into "bear mode" and "bull mode." Works very well I must say. Certainly, was easy to see this time around. I also like Walk Forward Optimization - though I think you'll find the most robust methods really change very, very little with regard to parameters (which is what makes them robust). Kevin Davey is a guy that really takes that concept to another level. He's won multiple Trading Championships using modified, robust walk forward analysis. Great post!