
Volatility Expansion on the Horizon?

Election Disparity - Same Date Different Outcome?

Just because it is an election year and we have the potential for the same person to win. We cannot assume that we get a re-run of the past.
This video explains my perspective on the volatility compression and expansion cycle. I focus on the election and the assumption that people may expect the same outcome because the candidate is the same. However, I demonstrate that 2017 and 2025 occupy very different positions in the cycle.

Here, we have the current long-term trend bands for SPY.
The sharp decline in 2020 led to compression within a year, as there were no significant moves by our measure afterwards.
In contrast, 2022 saw a drawn-out decline over almost the entire year, which delayed the ultimate compression to where we are today.
In my post yesterday, I mentioned the “black line of doom,” which on this chart represents the area below the red level. Such an occurrence is rare.
This level of selling pressure is infrequent, but when it happens, it often triggers the next expansion of the bands, causing the levels to shift progressively lower.
Looking at the 2022 chart, you’ll see a final “black line of doom” selling pressure followed by a new three-month high. This was followed by another selloff into October 2022. While this selloff marked a new nominal low in SPY price, our trend measure—lacking a better term—showed a “higher low.” This triggered the next compression phase and the start of the new bull market.
Now, consider Tyler Technologies (TYL), which I highlighted as a potential options trade candidate based on its proximity to the “black line of doom.” TYL appears to have entered its volatility expansion phase.

However, we cannot simply copy and paste the SPY/SPX cycle onto all U.S. equities due to the extensive hedging complex around SPX and the VIX.
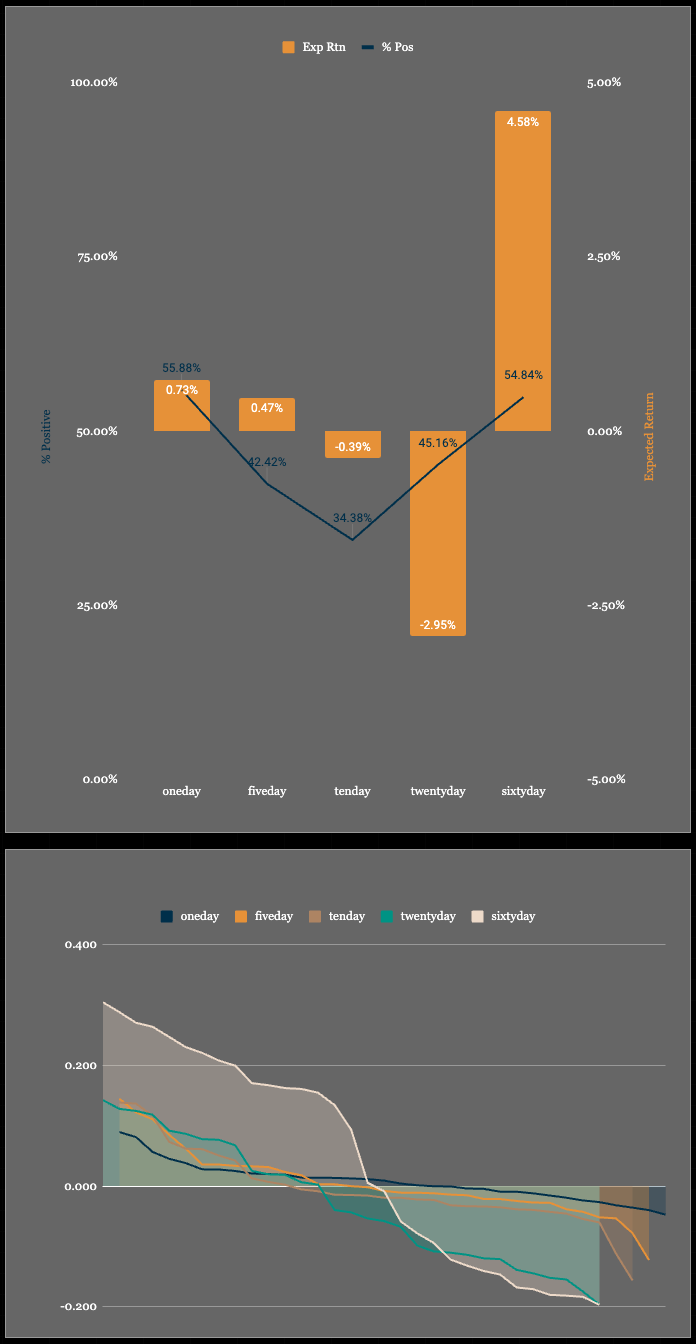
The backtest trigger for the “black line of doom” shows forward returns at 1, 5, 10, 20, and 60 days after the trigger.
I highlighted TYL for an options trade due to its 50/50 coin-flip likelihood of a positive outcome. Unlike buying the underlying asset, trading options caps potential losses at the premium. This is discussed further on Discord.
This post focuses more on the concept of expansion. While the trade triggered above may work, if any bounce results in a lower high relative to our levels, it could exemplify what I’ve been explaining about index-level behavior.
This systematic approach is a strong example of consistent methodology. While these triggers share a common theme, the optimal execution strategies differ.
We are now closer to an SPX band expansion than at any time since October 2023. That does not imply it is imminent. History provides a path, but as Wall Street reminds us:
“Past performance is not indicative of future results.”
So why do they show us past performance?
At the very least, it offers a glimpse of what has happened before, enabling us to navigate the future more effectively.

Hope alone won’t help, but combining backtests and measures with effective risk management will guide us through.

Here is my portfolio post from this weekend.