
Prepare for the Worst, Plan for the Best
Week 02 - Equity Portfolio Update

I highly recommend using the link to view these posts in a desktop browser. Substack limits the size of emails, and since I use a lot of images, some readers have been missing important data by only viewing the truncated email.

~2.5% move higher is needed to regain momentum and trend.

The Stockdale Paradox is a psychological duality that involves maintaining faith while also confronting the harsh realities of the present.
Hope and faith are not particularly helpful in this context, but they are important to how I think about building this portfolio.
The positive forward outlook is always focused on finding opportunities to be long, provided they meet our criteria. Additionally, the structure of US markets has, at least until now, favored positive outcomes.
We cannot ignore the realities of equity investing—large drawdowns do occur. Therefore, we have a system to measure where we are and where stocks may be in relation to the past.

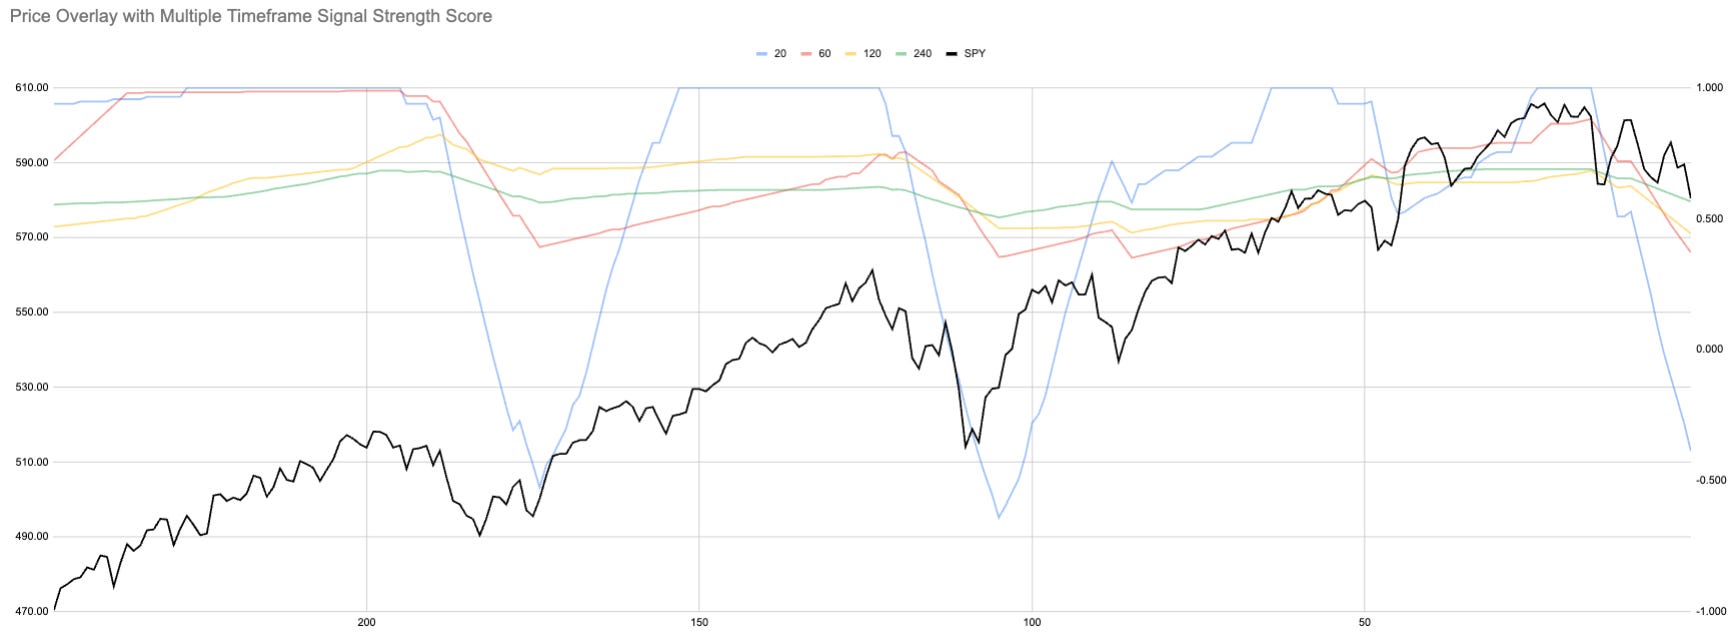
There are multiple layers to how we measure US equities (SPX). This chart illustrates our trend measure:
When we are above trend, positive outcomes are more likely, though they tend to be smaller.
Below trend, outcomes become a coin flip, but the swings—positive or negative—are far more extreme.
Thus, when my signal advises exiting SPX, I simply step aside. A big bounce could happen, but so could a significant drop.
Sometimes, when our portfolio allocation is at its most bullish, I write about potential negatives. This is part of preparing for the worst.
It doesn’t really matter what potential outcomes I write about day to day. The system dictates our actions, allowing us the freedom to think independently of the portfolio.
This approach prevents us from being swayed by every change in market narratives.
Sometimes, “narrative land” might be correct, and that’s okay. The problem is that it’s not repeatable.
Daily timeframe:
All signal strength measures continue to fall.

We would need to see 575 on SPY to hit another “black line of doom” value. I use this term humorously because the media often predicts recession and demand rate cuts at these levels. In reality, the price spends very little time below this threshold.
Why?
I’ll make a separate post on this, linked to TYL, which I used as an example in the subscriber Discord.

Short and Long term momentum continues to fall.
Le Croissant crumbs.
We remain in positive territory until the end of this week. That has not helped price action so far, but could we get a counter-trend bounce

Realised volatility continues to rise.

Current Open Equity = 33.2%
Stop Loss Trigger = 31.2%
Current Closed Equity Return = 33.2%
Our open equity outstanding is ~33% since we started in Dec ‘23. We have been able to capture ~33% returns in closed trades, meaning ~0% open equity still belongs to Mr Market. Until we close the trade it doesn’t yet belong to us!
If all our stop losses hit bar any gap risk we hope to close ~31%
It cannot always be rosy! There is no free lunch we have to risk losing to be in the game to win. We could have a -2% drawdown. If you were one of the last people dragged into quantum computing some of those were down 50% last week. I prefer our way.
Subscribe to see the portfolio. You can do it for free using the 7-day trial if you want.
And our current open positions:

Positions we closed this week:

Please subscribe to see more of the portfolio we are constructing.
New user guide - Paid Portfolio Posts

Hot Takes with Hank

Subscriber Discord
