

TL;DR

The wiggly green line is green.
Original post is linked here.

Todays Hot Takes with Hank where I discuss time and how we may need to shift our view of it to get the whole picture.
I screwed up my post on Wednesday somehow I changed a distribution setting or something??
Anyway this I hope builds on Wednesdays post and my Hot Takes with Hank ( both linked above) to discuss the recent moves.
OK so where are we today?

For the timeframe I care about the most the wiggly line is Green 👍
VIX would need to break above 26
SPX breaks Trend ~5540
If it’s not broken don’t overcomplicate it.
Lets move down a timeframe as that is where the nuance exists currently.
Why did I sell some exposure on Wednesday but not before when you had these sell signals?

The timeframe itself is a weaker signal as I focus on daily prices.
The Strength of Signal measures were rising but not “too high” (think in terms of the dots and stars chart I share each weekend).
We had “fundies” VIXperation. This decision was made on a leveraged trade not a vanilla trade. The structure not only the price was important to the trade.

You can see at the top of the chart where we don’t spend very much time (reverse Black Line of Doom?) we now broached those to the downside.
And it is hard to see and better illustrated below:

Because the volatility bands were highly compressed a small move created meaningful sequence in the data.
That sounds wonky but it feeds into the audio I recorded this morning. “Meaningful” moves can come in time or price. Many people get caught on price.
“The market will be oversold at 5400 which is where I will buy back in”
What I am trying to say is the path is important. What has happened in the past plus how it moved from 5800 to 5600 means it might be mathematically unlikely to ever reach 5400. Not impossible of course.

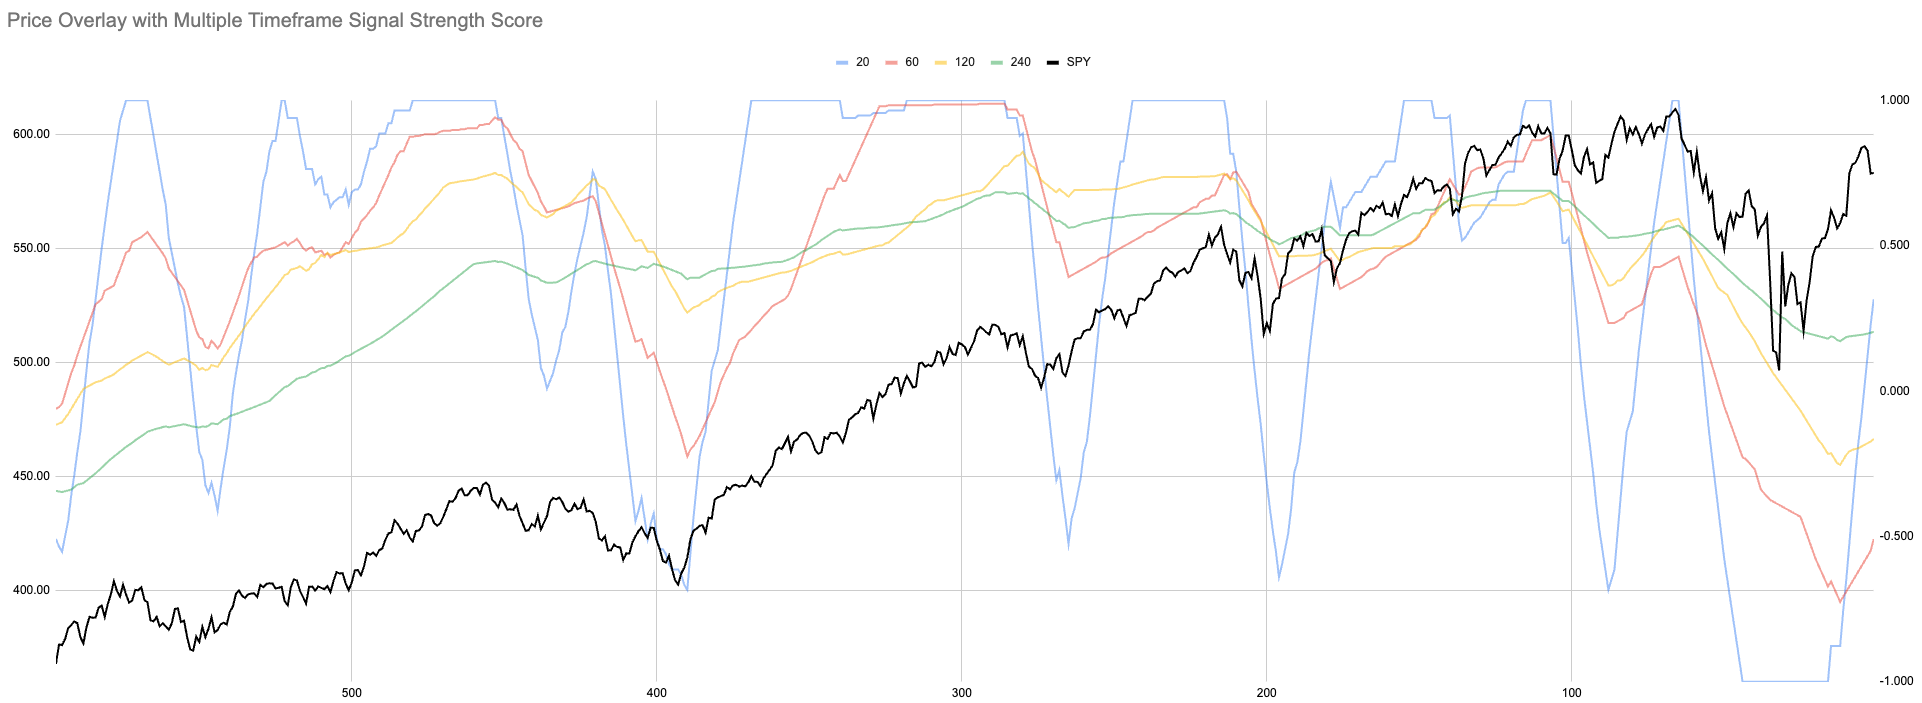
Here we are using hourly data but with 3 different look back windows to calculate trend. We have broken the shortest timeframe but because of the past those slightly longer are rising still.
This could mean they are easier to break as price and trend could quickly converge. Yes this could happen.
But, hourly data at least in how I view market time at the moment is not as important.
Currently daily measures are all still rising from oversold levels if you want to use that parlance.
Price and Time.
How those two interact through volatility is very important.
I hope this makes sense. If not please ask any questions in the comments or message me directly and I will try to answer them this weekend.
If it was clear as mud just read the TL;DR ;)
New user guide - Paid Portfolio Posts

Hot Takes with Hank

Think pieces!

SP500 Portfolio Update

Gold(en) Opportunity
