
SimpleSPYman
Week 07 - SPX/SPY Index Update

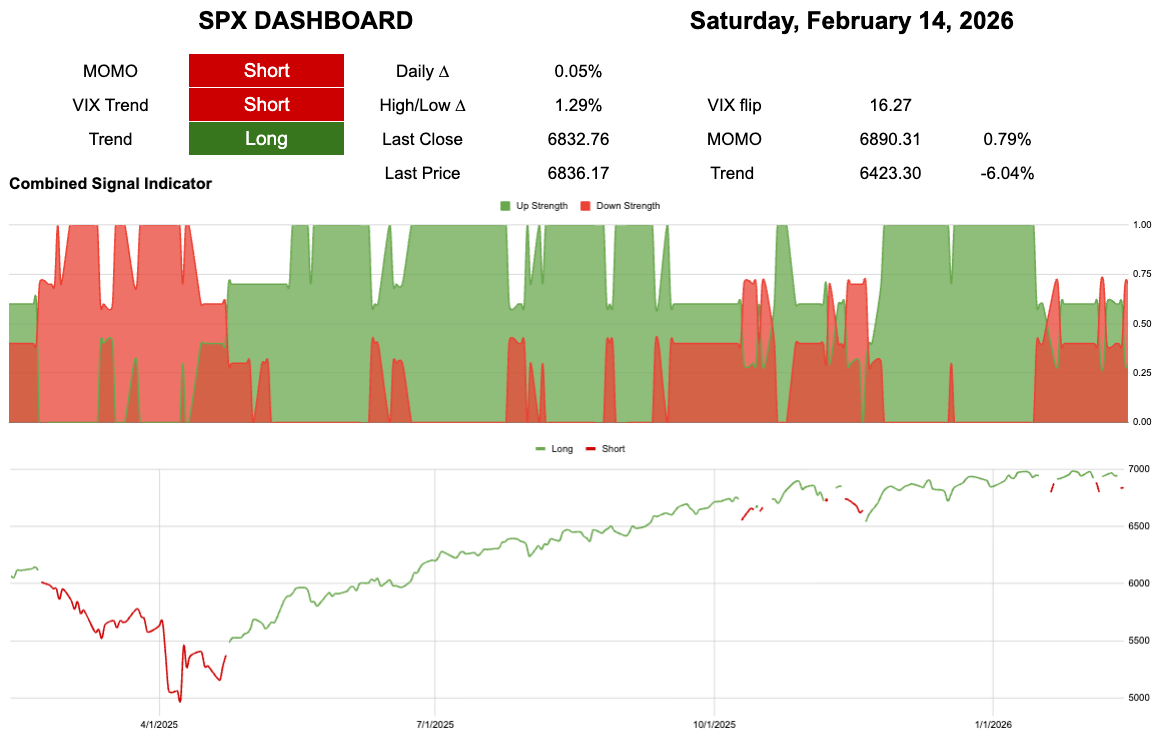
6890 0.79% to break momentum
6423 -6.04% to break trend
I keep listening to podcasts and everyone is saying “wow 13th of Feb 6 weeks feels like 6 months or 6 years” but be honest..
What has happened?
If you are one of the many “normal people” reading this someone with a normal job paying his or her bills and trying to invest for the future, and not a “talking head” type..
Would you even know any of the bullshit the macro guy is babbling about?
Did it help?
We are below momentum.
Buy some puts or maybe don’t buy anything new.
Or do nothing because we are still above trend.
I cannot make it any simpler than this!
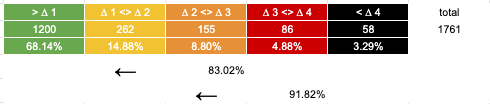
It is all the same chart so I can use all the same data. In the last 1761 trading days SPY has been above “trend” i.e. in green or yellow 83% of days.
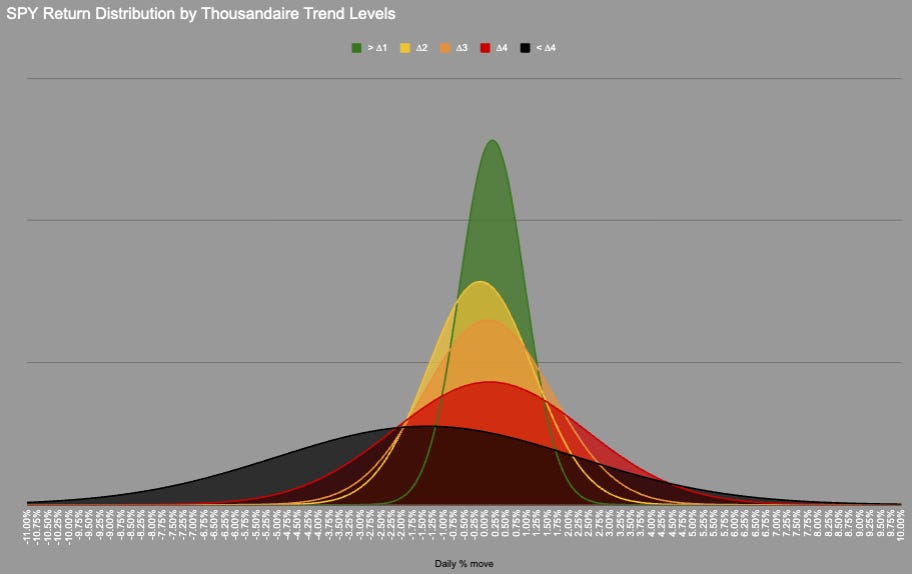
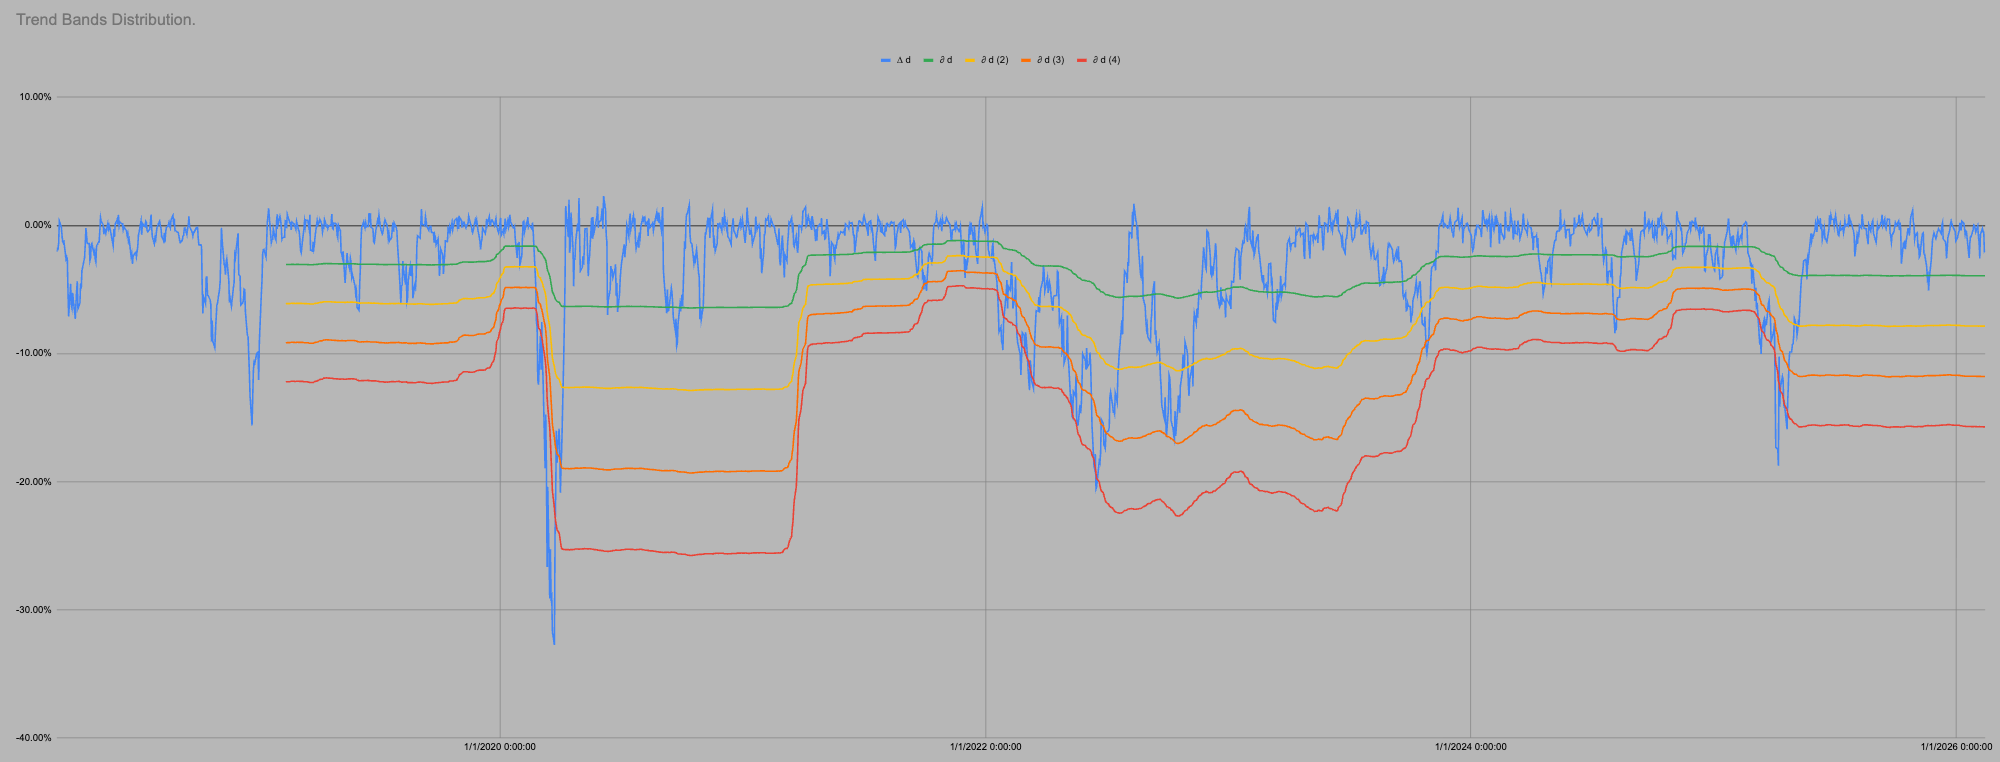
We could probably include orange as the distribution is very similar, but we need a transition point.
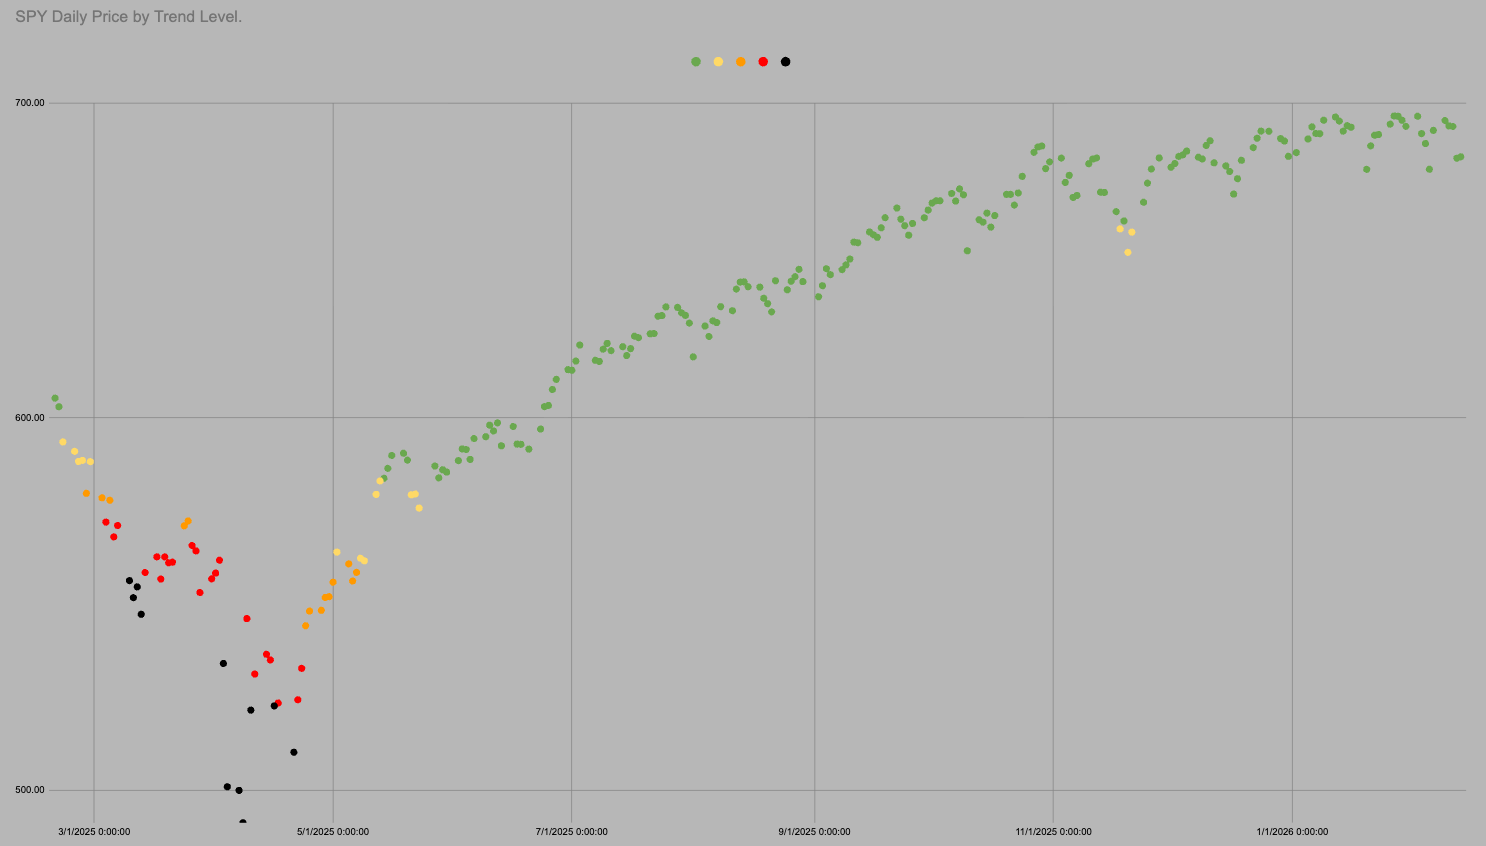
In 1761 trading days price has never moved directly from Green into Red/Black there is always an intermezzo hangout in Orange.
That’s it!
Simple maths but looking at the data first through a different lens combined with simple decisions.
I know not everyone uses the app but you really should, I post things in there that are too long for full post.
SimpleSPYman.
New user guide - Paid Portfolio Posts

Hot Takes with Hank

Think pieces!

