
SimpleSPYman
Week 08 - SPX/SPY Index Update

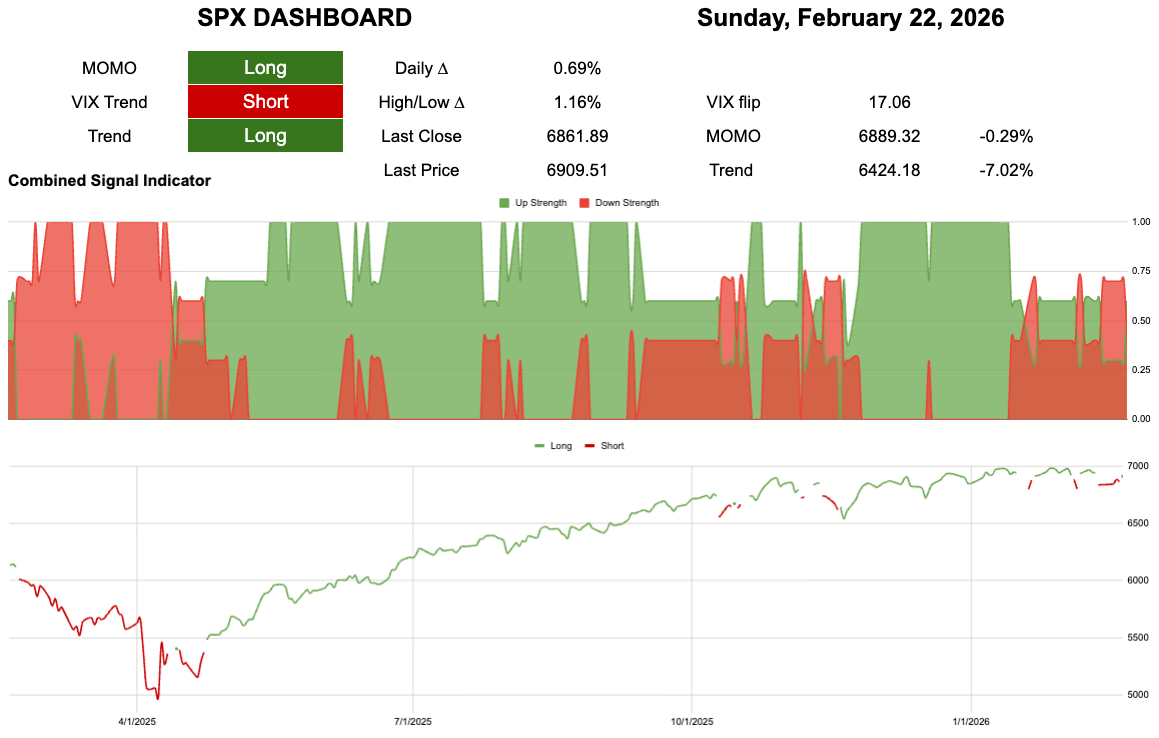
6889 -0.29% to break momentum
6424 -6.04% to break trend
I cannot make it any simpler than this!
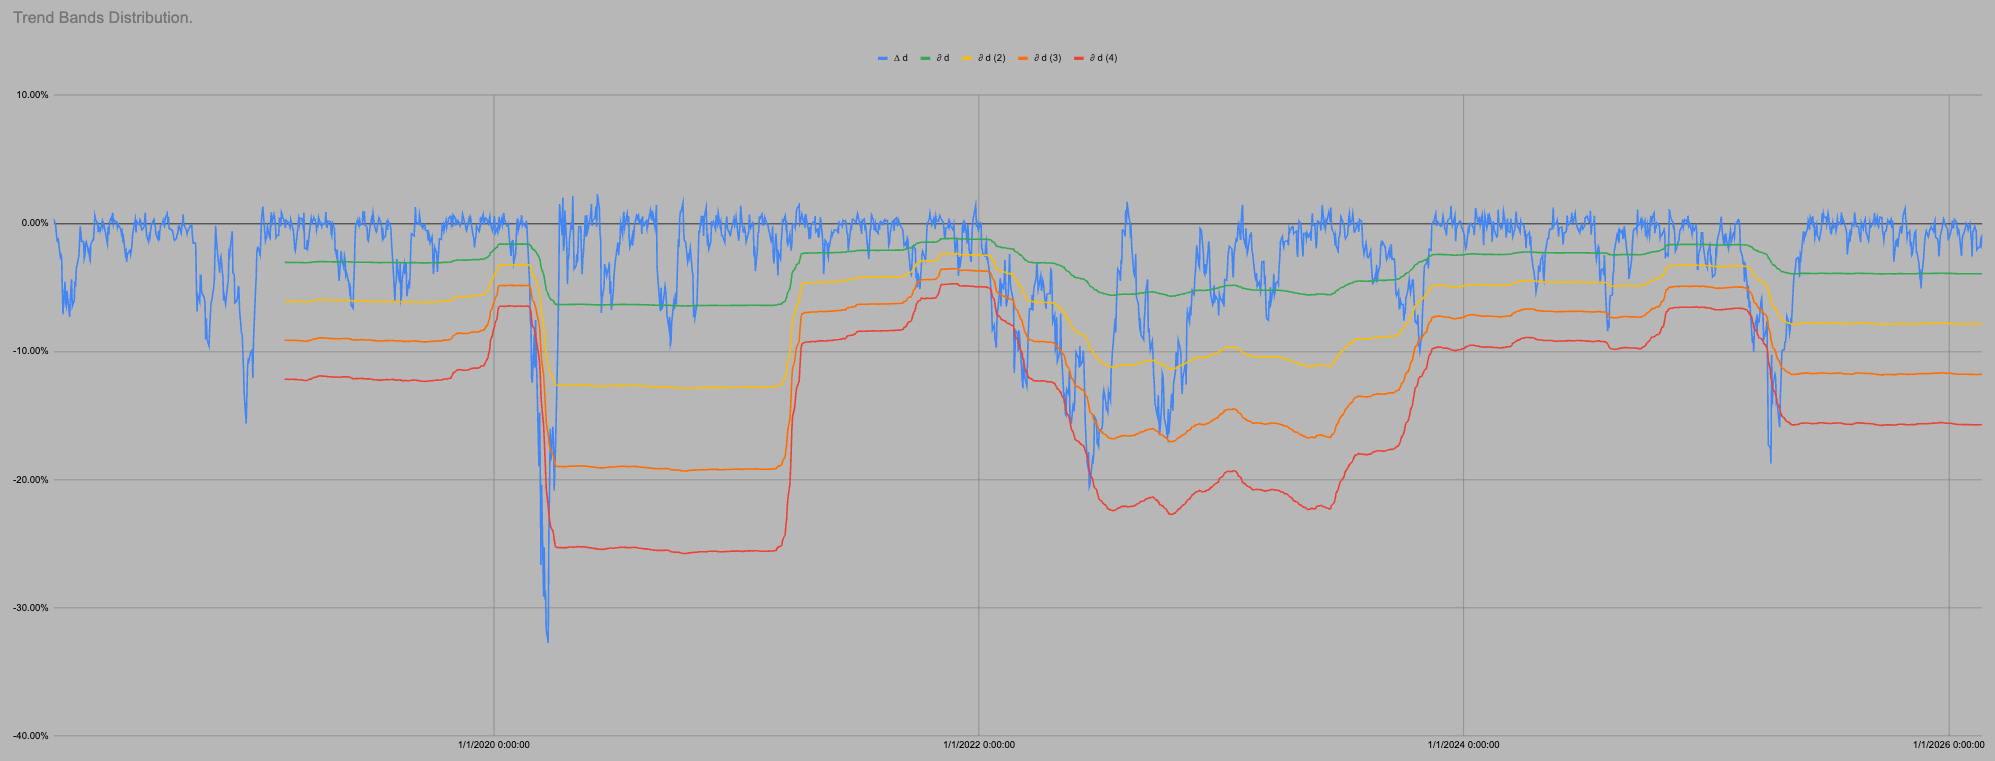
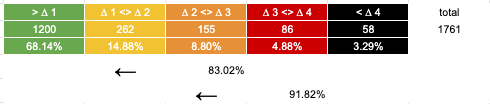
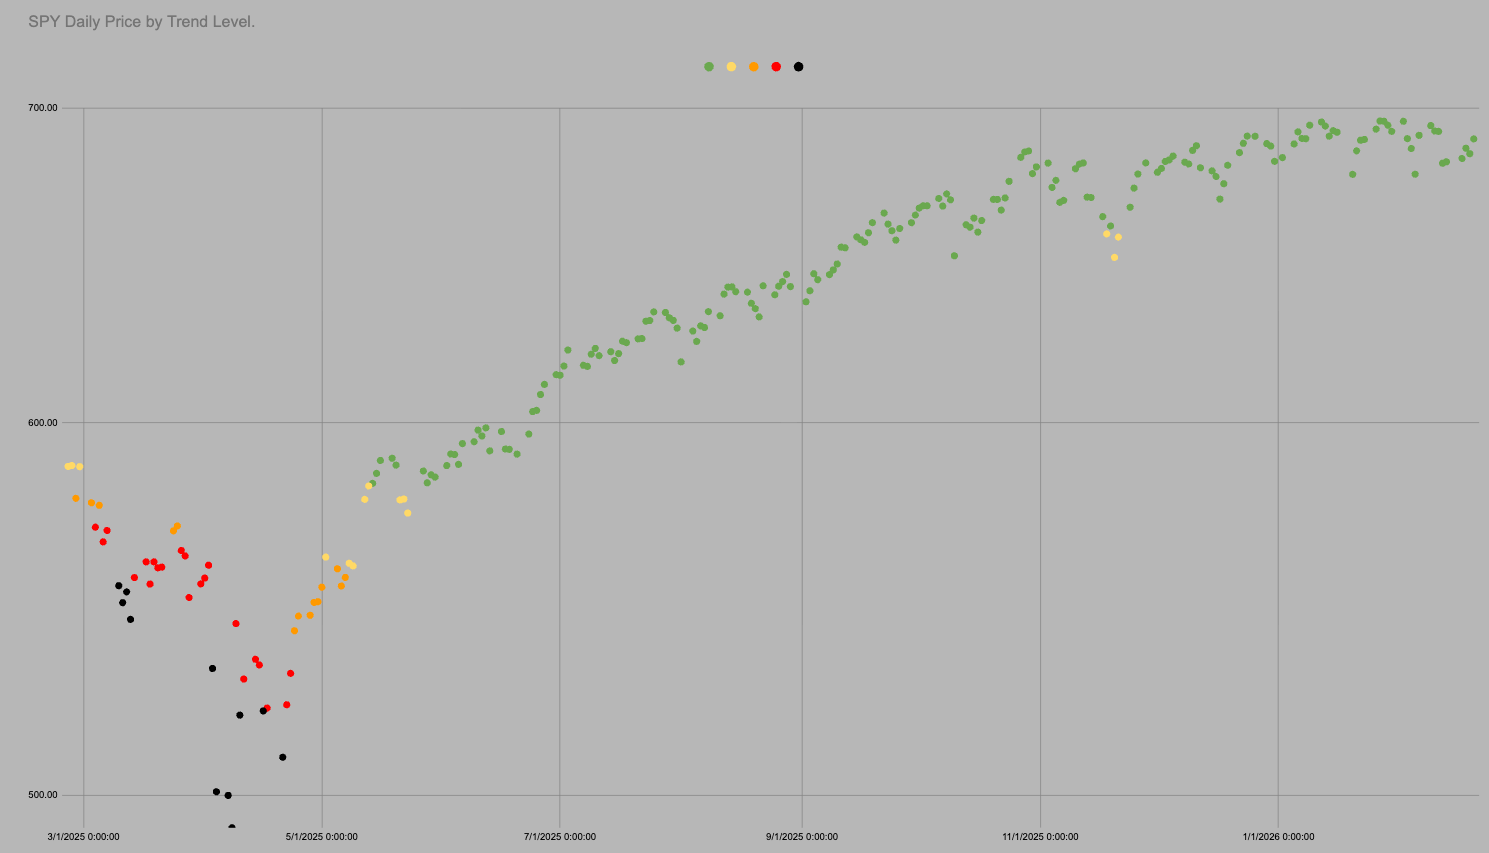
It is all the same chart so I can use all the same data. In the last 1761 trading days SPY has been above “trend” i.e. in green or yellow 83% of days.
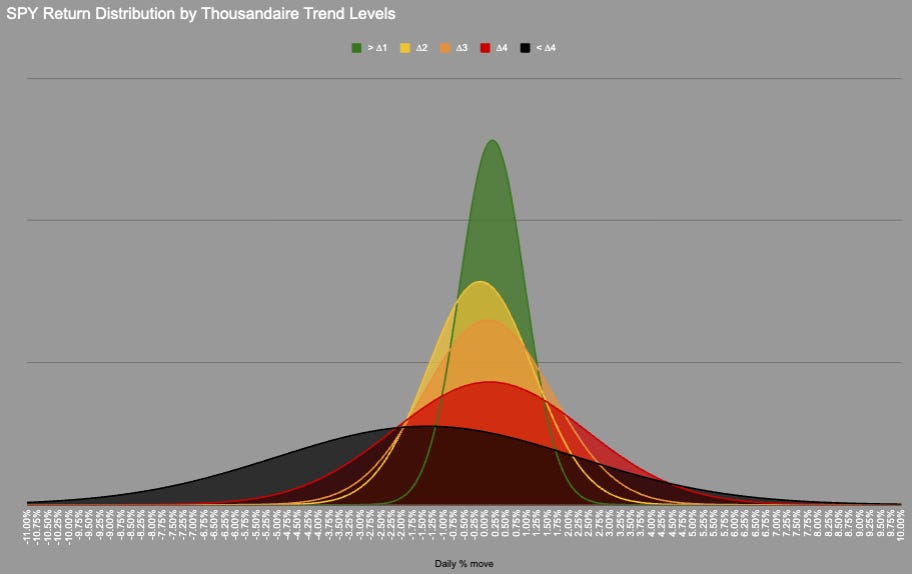
We could probably include orange as the distribution is very similar, but we need a transition point.
In 1761 trading days price has never moved directly from Green into Red/Black there is always an intermezzo hangout in Orange.
That’s it!
Simple maths but looking at the data first through a different lens combined with simple decisions.
Snippets this week from the App.
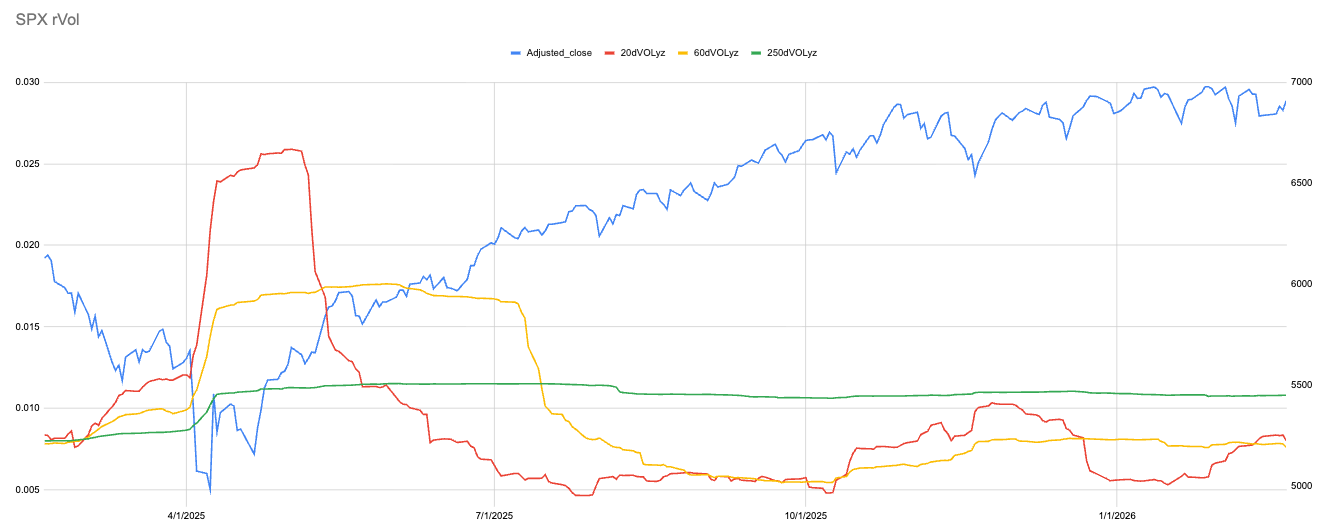
A very crude way to calculate position sizes is to use 1/variance. Coming into 2025 annual variance or volatility was 8 using my small brain measure, then it went to 12.
1/8 to 1/12 so the position size would have to be smaller. What happens when the number starts falling again?
SimpleSPYman.
New user guide - Paid Portfolio Posts

Hot Takes with Hank

Think pieces!


I like the data-first approach and how simple math highlights actionable insights