
SimpleSPYman
Week 06 - SPX/SPY Index Update

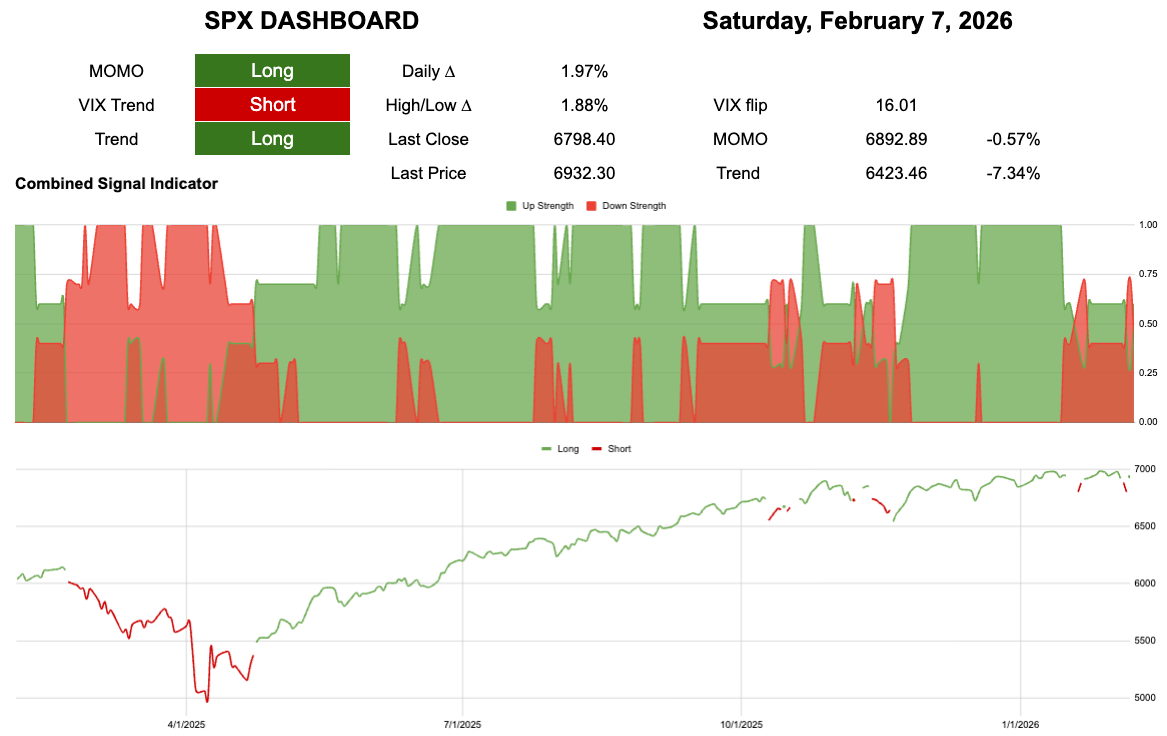
6892 -0.57% to break momentum
6423 -7.34% to break trend
If like me you treat “financial news” which I now include podcasts etc. They are no longer the podcasts we had available during COVID they have been subsumed and tilted with ads and blah blah.
I treat the news if I view it at all no different to watching Teen Titans Go with my boys, it is simply a form of entertainment.
With all of the hoopla from its high last week to its low this week SPY was down -2.93%.
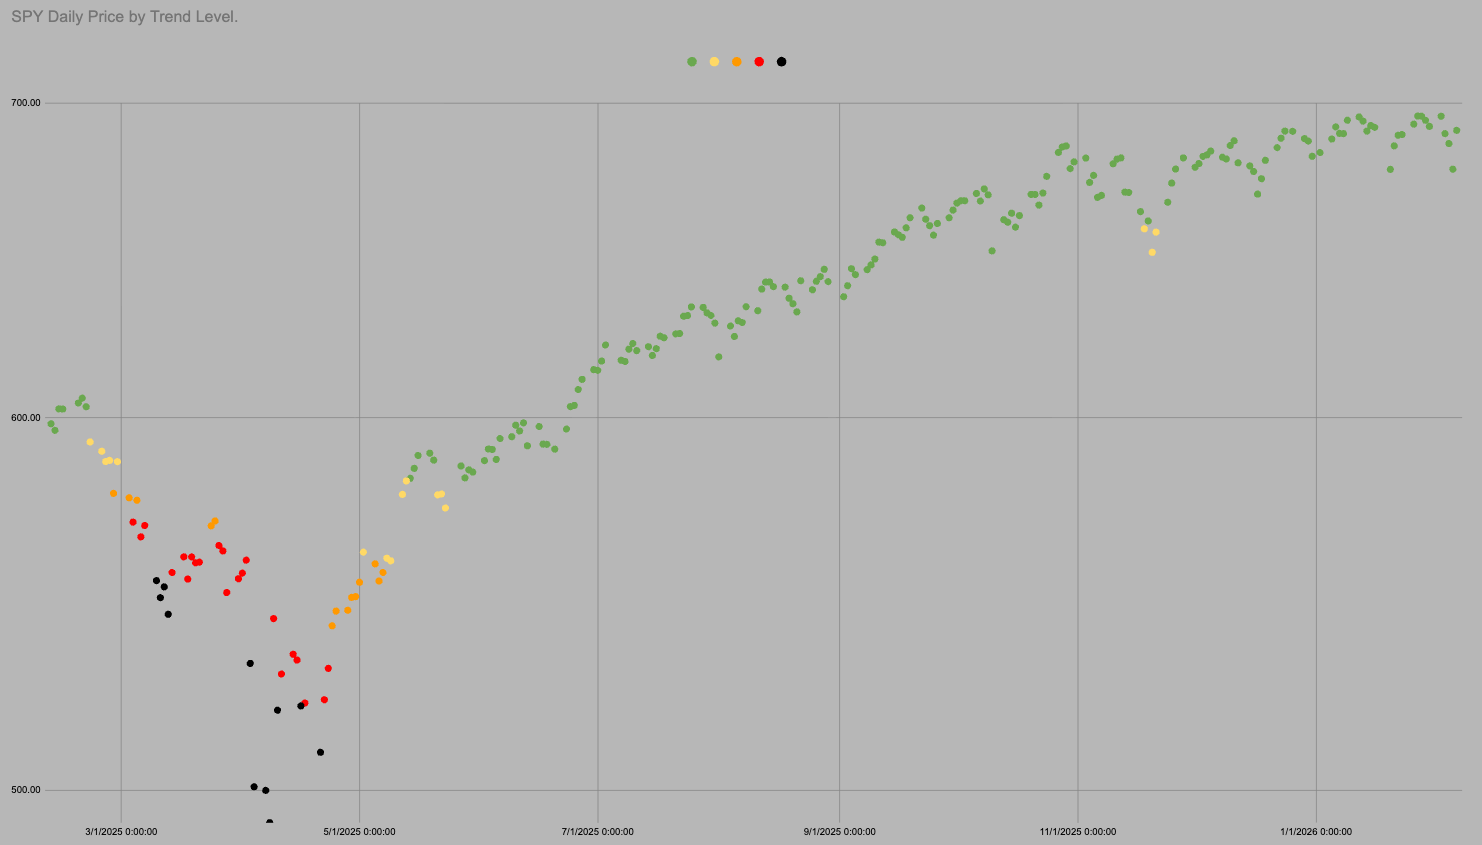
I cannot make it any simpler than this!

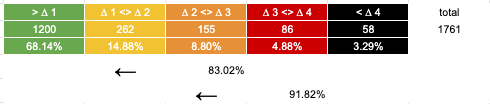
It is all the same chart so I can use all the same data. In the last 1761 trading days SPY has been above “trend” i.e. in green or yellow 83% of days.
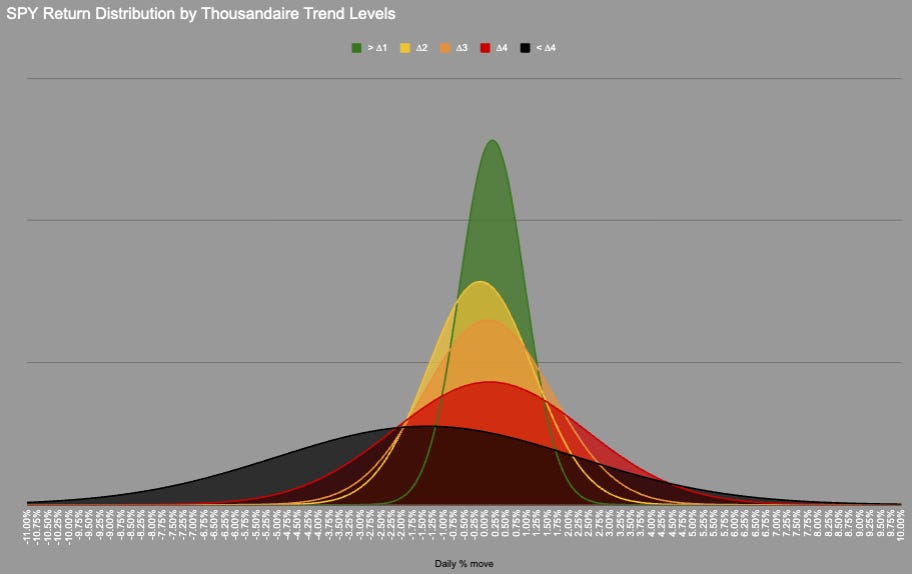
We could probably include orange as the distribution is very similar, but we need a transition point.
In 1761 trading days price has never moved directly from Green into Red/Black there is always an intermezzo hangout in Orange.
That’s it!
Simple maths but looking at the data first through a different lens combined with simple decisions.
Here is a freebie of QQQ tickers because everyone has got their knickers in a twist over tech.
No apologies I don’t make chart porn charts I make useful stuff for me so this looks like a dogs dinner.
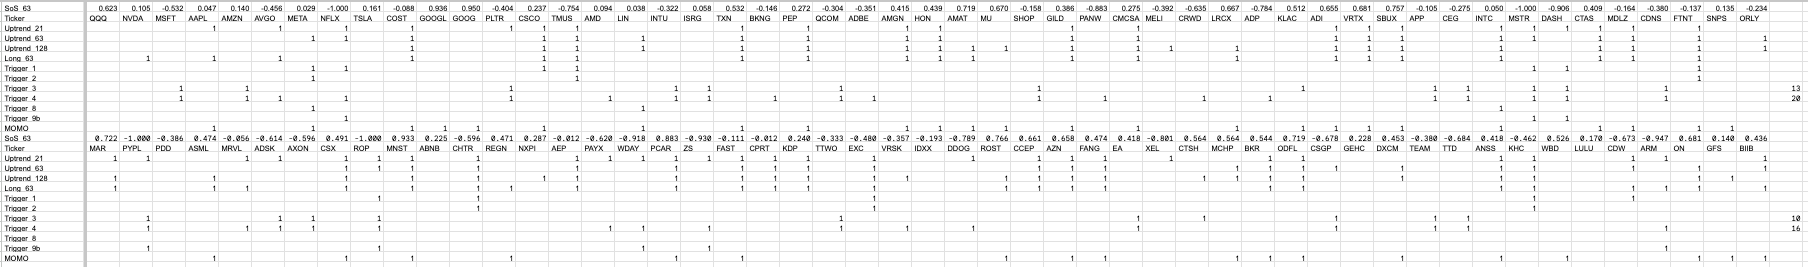
25-30% of tickers have triggered either “black line of doom” or dual negative momentum, I put a count next to them. Now we got a bounce on Friday and maybe that’s all we get.
But…
Before we can have a crash we have to break trend, so chill out and go watch some cartoons with your kids.
SimpleSPYman.
New user guide - Paid Portfolio Posts

Hot Takes with Hank

Think pieces!

