

TL;DR

If you bought stuff well done!

This is the start of something it will be bumpy. If this is your first crypto ride that doesn't mean -5% down moves in a steady uptrend.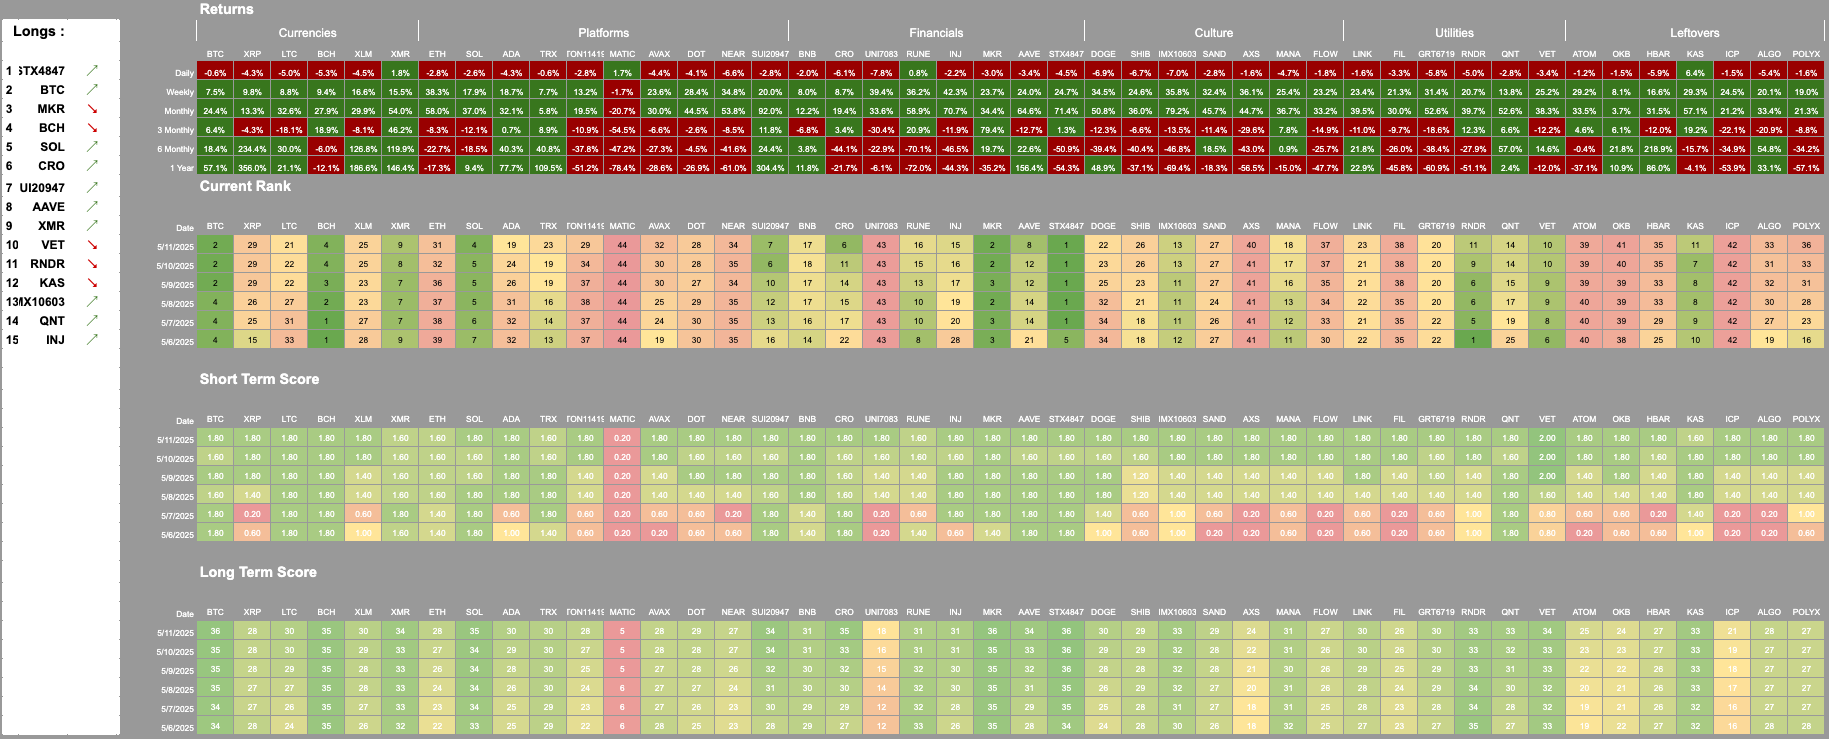
Daily close on crypto is 00:00GMT there has been a “Trump Pump” this morning off macro news nonsense, so lots of this red has been undone.
MATIC the only lonely ticker not long…

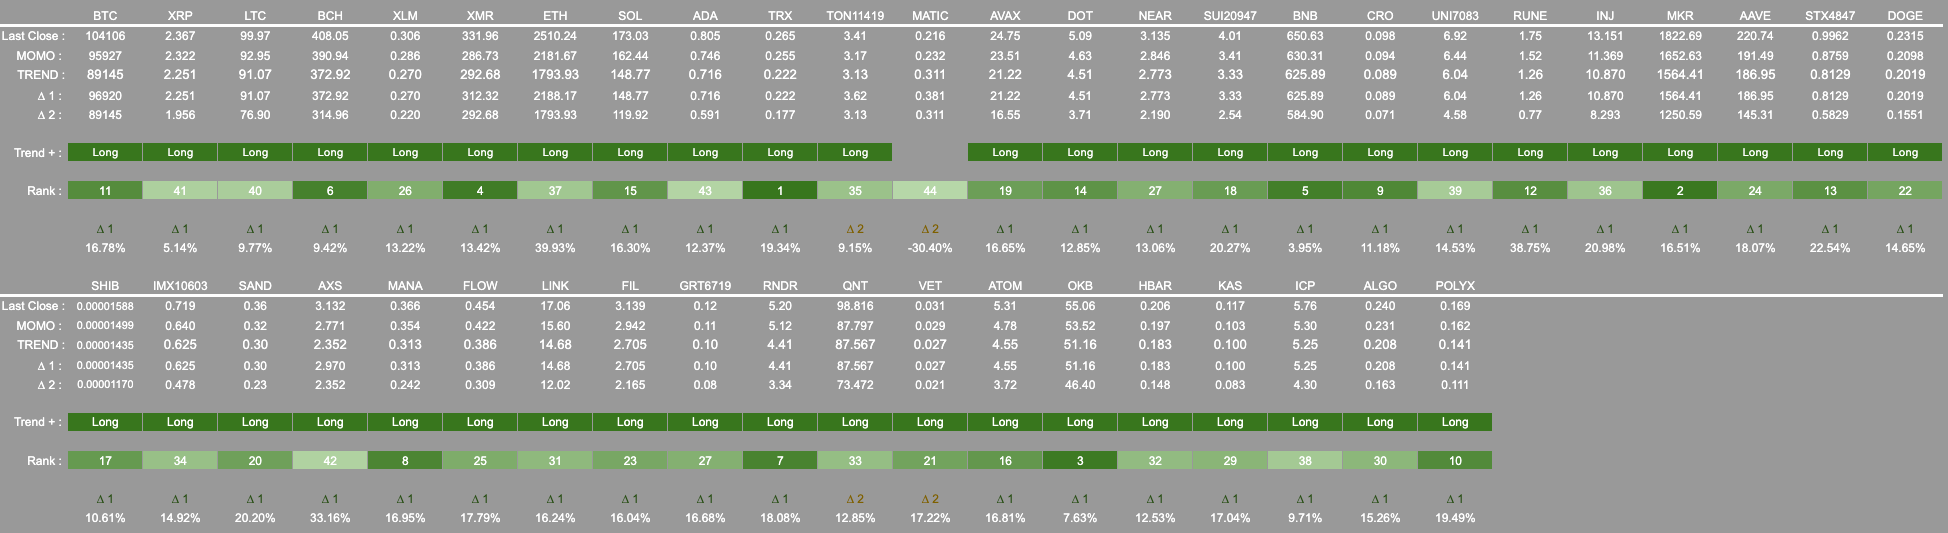
Names are more likely to move up the vertical axis then across the horizontal axis. This is because of the speed difference being tracked.
Could we be seeing TRX taking a breather here?

This is a messy chart but it is a quick way to view lots of data. Think of these dots as looking straight down the end of a line graph. So here we are looking at 132 charts at once.
Red shows the current value of the measurement SoS (Strength of Signal) and blue shows an average of where in the past the measurement has peaked.
This is not a predictor but again if we use TRX using the short term measure it has peaked and started to fall. Medium it has converged on a peak measurement of the past. Long it is not quite a peak but very close.
Someone who is too clever by half might think “great a pairs trade short TX and long MATIC”. That is a possibility or we could just sell TRX if it breaks trend and buy MATIC if it gains trend. Nice and simple.
Take care of your losses and the wins will take care of themselves.
We are coming from very low Strength of Signal measures across the board. The first steps are always bumpy feel your way into this rally.
New user guide - Paid Portfolio Posts

Hot Takes with Hank

Think pieces!

SP500 Portfolio Update

Gold(en) Opportunity

Discord Channel - open channel available to all.
https://discord.gg/vsdBws3Rmg