Who knows?
Wednesday 8th May - Daily Equity Update
If you have an index consisting of two stocks of equal weight i.e. 50% and stock A goes up 5% and stock B goes down -5%.
Now the SP500 etc are far more complex than that with so many moving parts, but it often pays to simplify as much as possible without destroying the question you are trying to answer.
This portfolio is not long the SP500 as an asset. I am trying to find the constituent parts that perform well.
Some think the index has moved to a price level over a certain amount of time, meaning it is “overbought”. That might be the case, but I am not long of the SP500 index. I am long of some of its parts.
Now I haven’t answered the opening question I will wait to see the results of the poll. Let’s jump on the simplicity though. People simplify “the market” into what an index is doing which is fine if all you trade or allocate to is SPY. We do not. So simplifying market action to an index doesn’t help us.
Perhaps I am lucky and the consensus is correct that the SP500 index falls, but our 40 longs are part of the 100 that go up while 400 go down.
Who knows? I certainly don’t! That is why I have a safety net that tells me when I need to reduce risk so as not to cause serious loss.
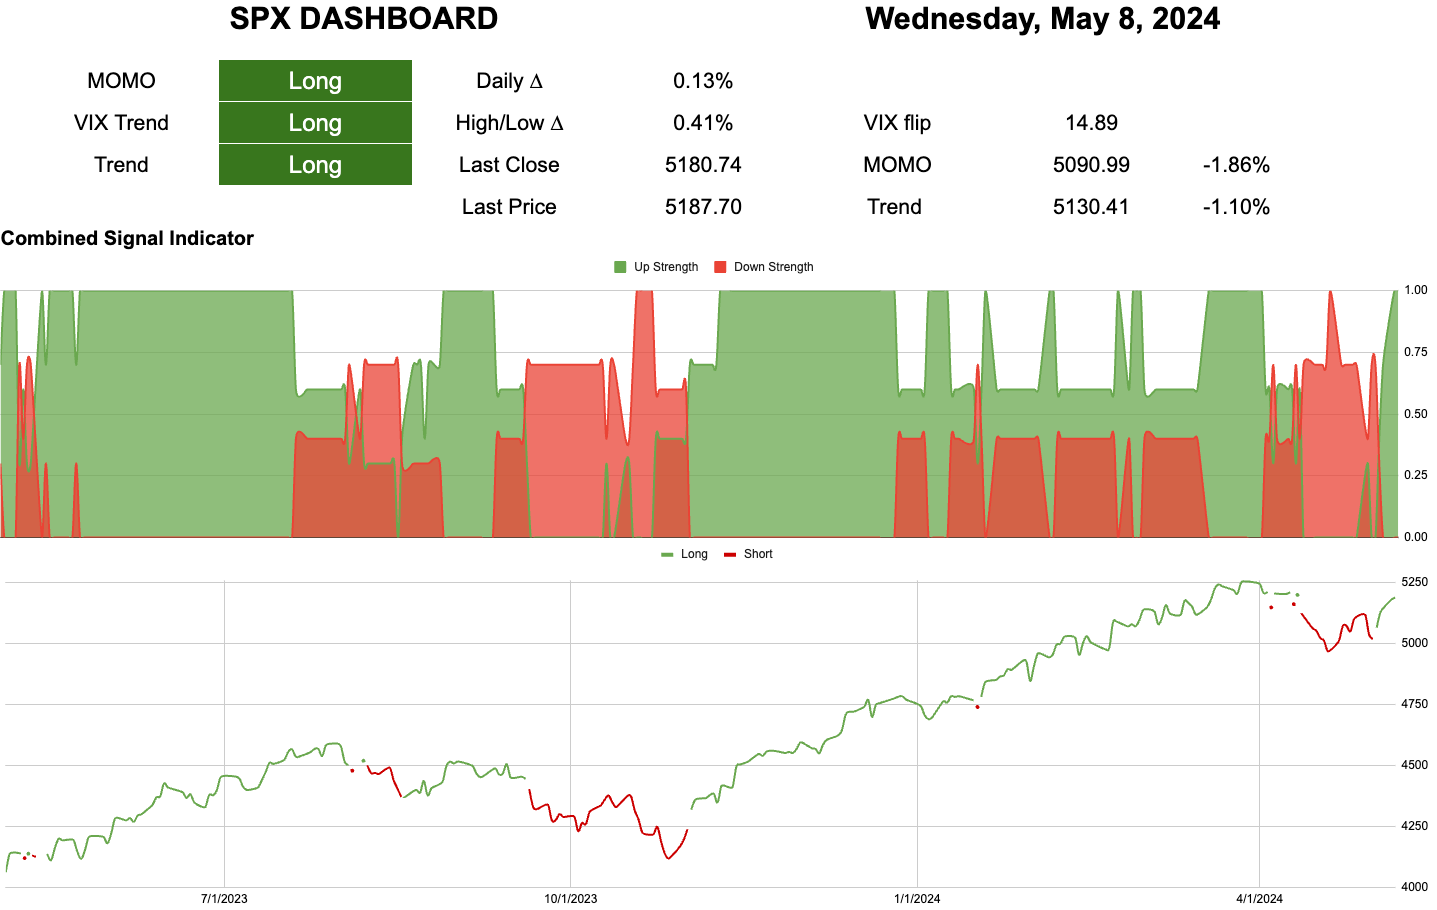
One - All the boxes are green.
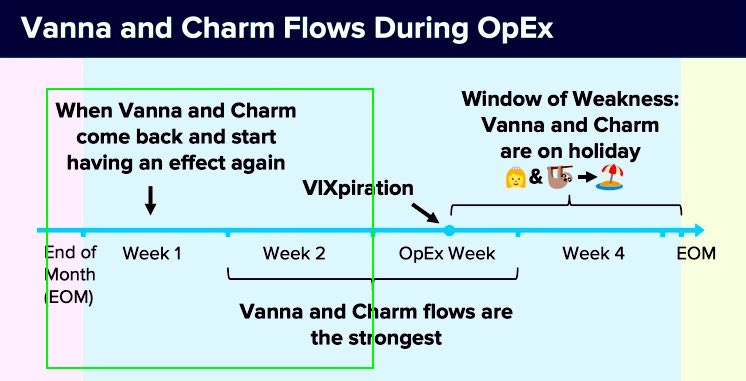
Two - we are also in this expertly drawn green box on the calendar
Three - when the combined indicator is at maximum the SP500 is higher the following day 78% of the time.
That means that the layers all point to one decision. Knowing that we can be wrong 22% of the time.
Is today in the 78 or the 22? Who knows?
You only get the odds if you keep making the bets.
Thank you to all our new subscribers! I need to write a user guide of some sort to help those who are new to what I am trying to share here. Until then feel free to ask questions using the comments section.
Search for thousandairefx on Twitter and send me a DM if you wish to remain private.


