The Best Free Chart in Finance!
Week 24 - Equity Portfolio Update
I highly recommend using the link to view these posts in a desktop browser. Substack limits the size of emails, and since I use a lot of images, some readers have been missing important data by only viewing the truncated email.
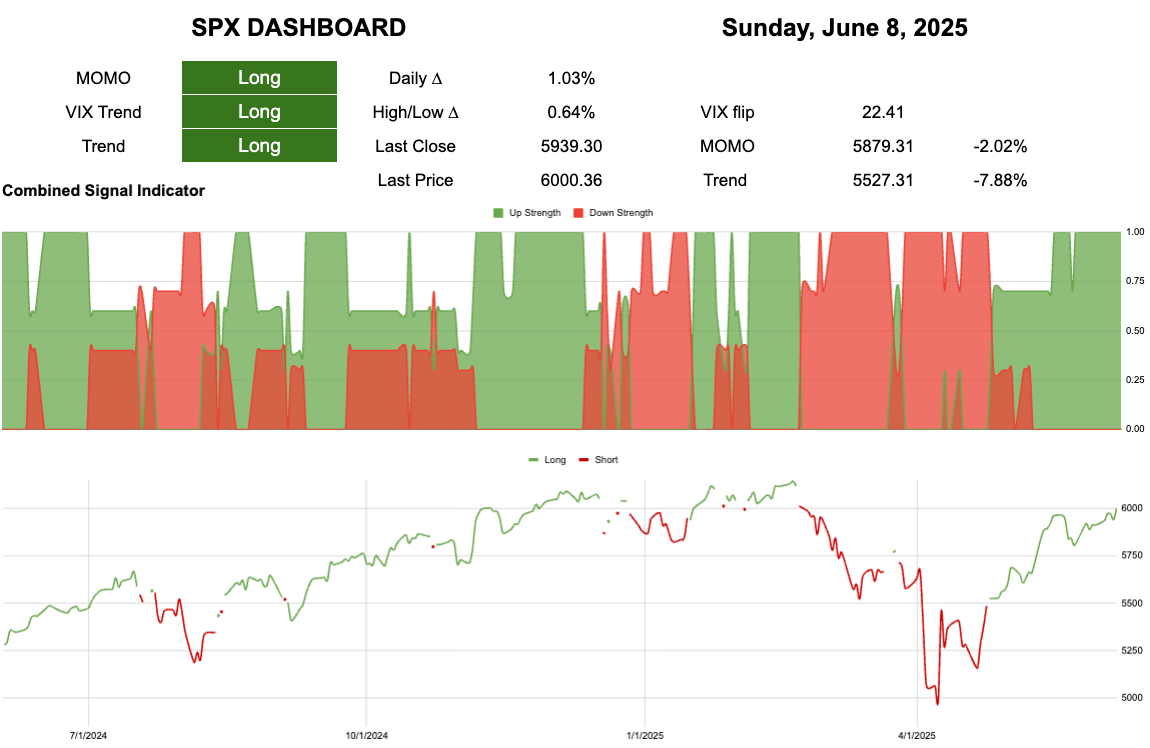
The SP500 chart of truth!
The biggest freebie in finance!
Daily
Here we can see where SPY is trading vs our trend levels.
Here we can see how often the SPY trades at those levels.
Finally this charts shows the distribution of returns at those levels.
The “black line of doom” so called because this is the point where most people that are still holding i.e. where “traders” become “investors” are throwing all their fundies out of the window.
Whereas the green area is boring grinding market territory.
These areas should be traded differently.
Black/Red are great for options: defined lose instruments which either really work or really don’t.
Green/Yellow : boring vanilla ETF holdings so that you can concentrate on other things. Those other things could be other assets or actually getting some work done ;)
Mr Croissant has our back.
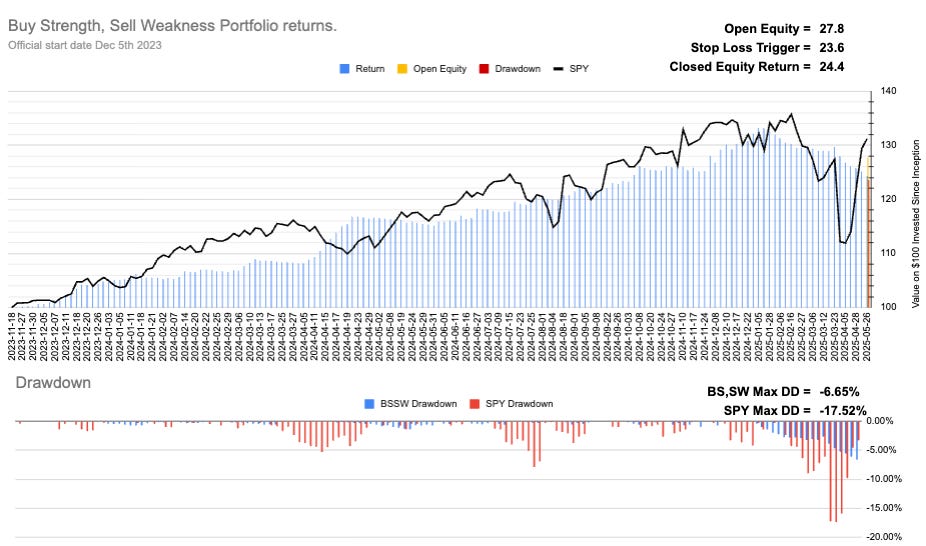
Current Open Equity = 27.8%
Stop Loss Trigger = 23.8%
Current Closed Equity Return = 24.4%
Our open equity outstanding is ~28% since we started in Dec ‘23. We have been able to capture ~24% returns in closed trades, meaning ~4% open equity still belongs to Mr Market. Until we close the trade it doesn’t yet belong to us!
Subscribe to see the portfolio. You can do it for free using the 7-day trial if you want.
New user guide - Paid Portfolio Posts
Hot Takes with Hank
Think pieces!


