I advise using the app/website as emails are often truncated due to images!
TL;DR
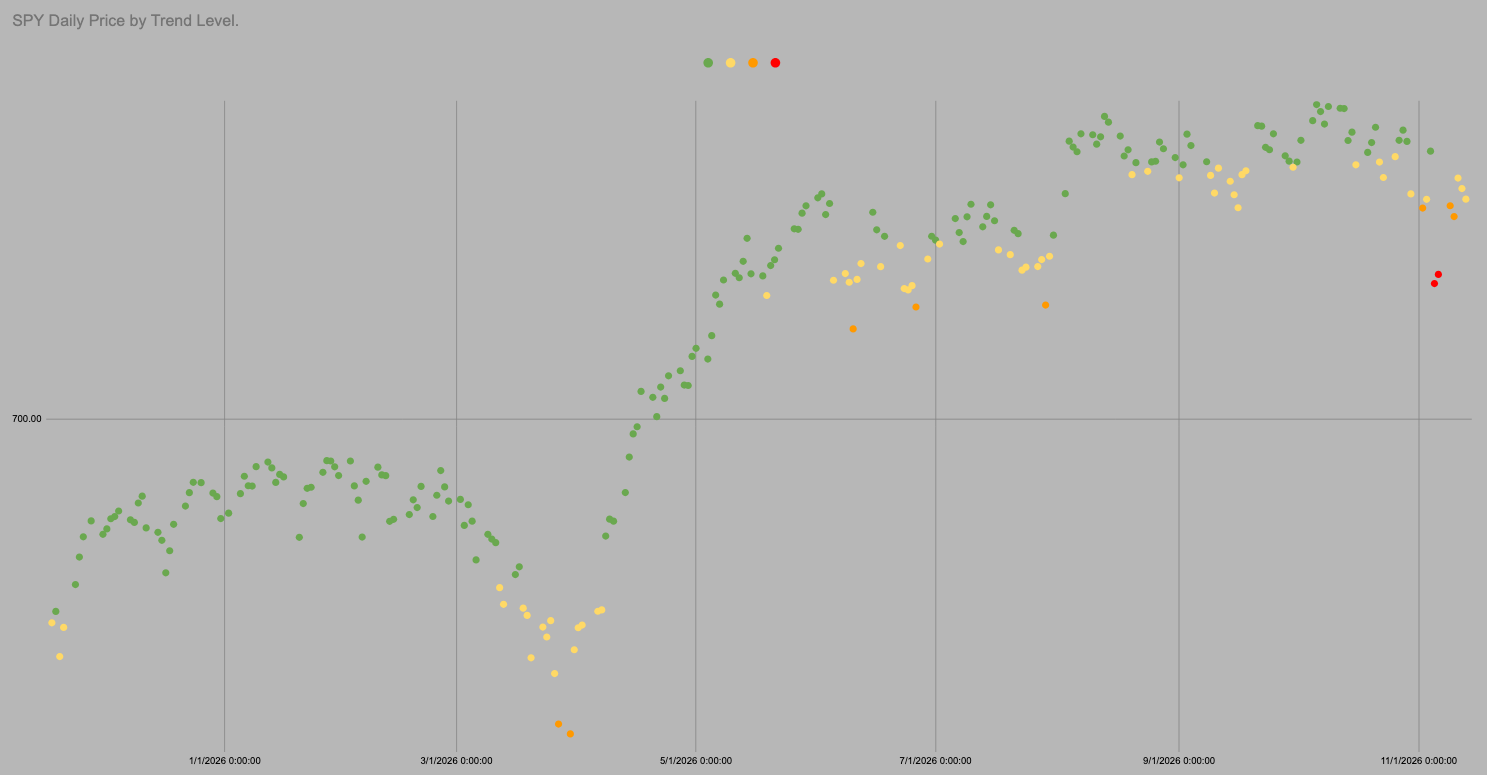
The dot is Yellow
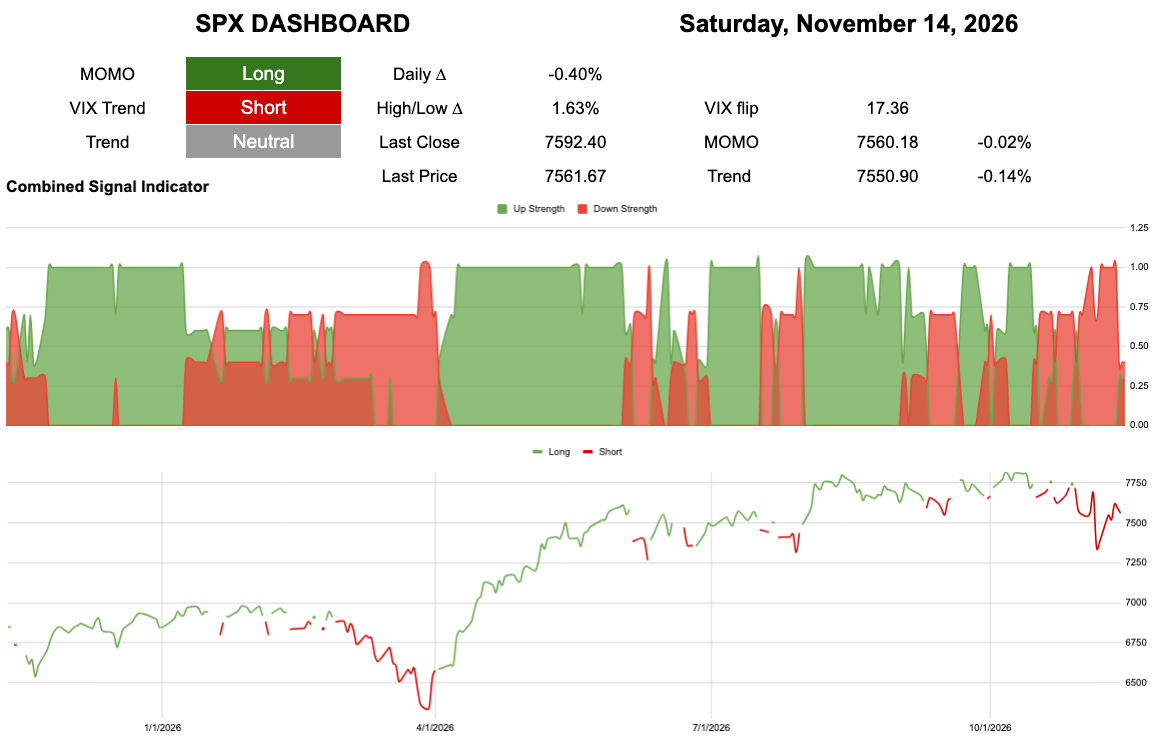
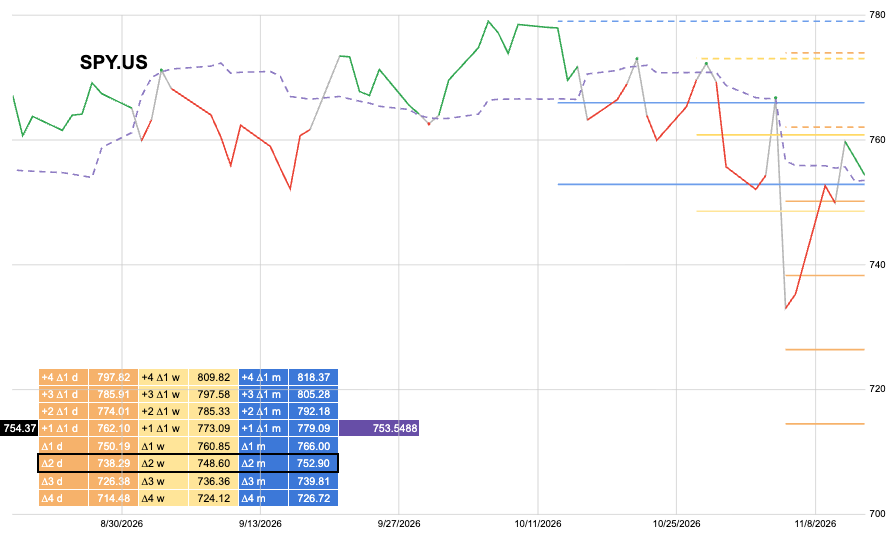
Trend is 752.90
From last week has anything changed?
“you said that last week Chris and the week before look where we are now!”
The double edged sword was out. The pain trade was a relief rally and that’s what we got.
We are back above trend.
The dot is Yellow
Trend is 752.90
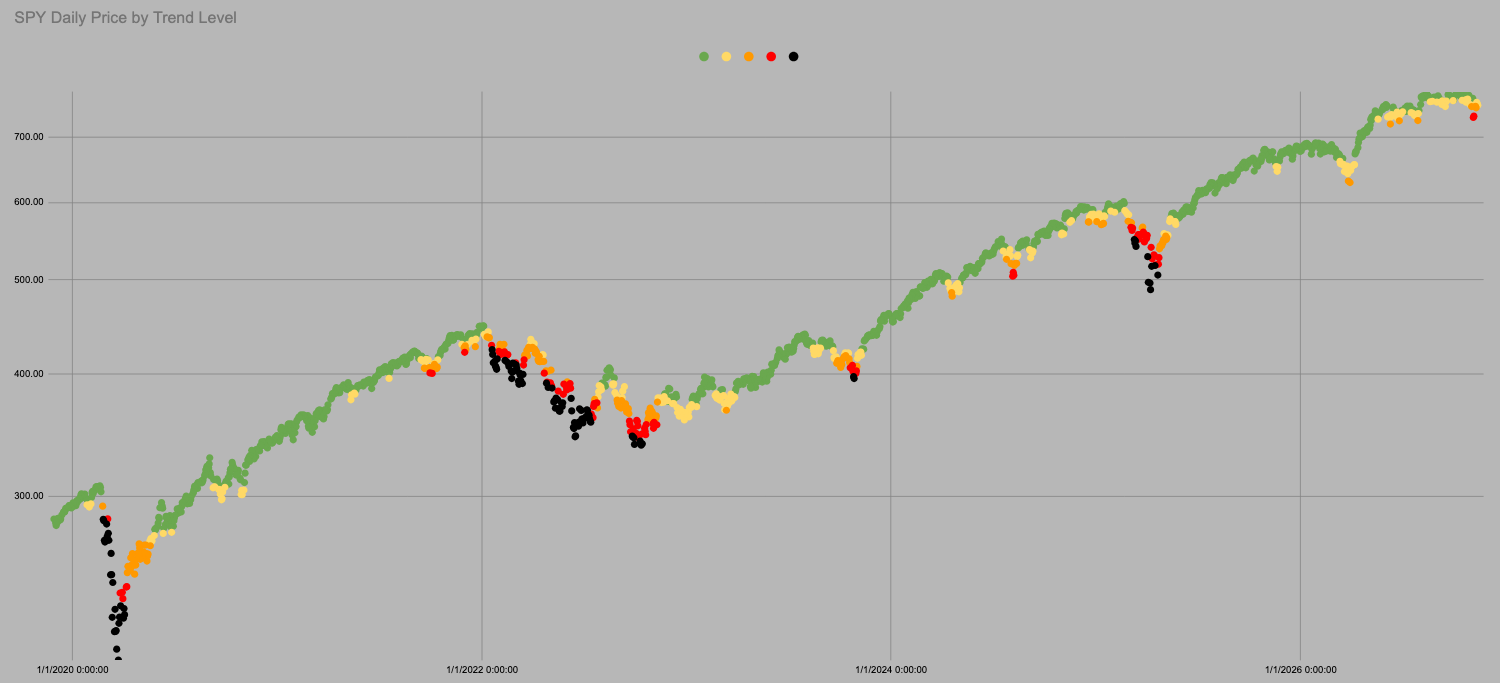
SPY spends 81% of all trading days above this level.

It is all the same chart so I can use all the same data. In the last 1761 trading days SPY has been above “trend” i.e. in green or yellow 81% of days.
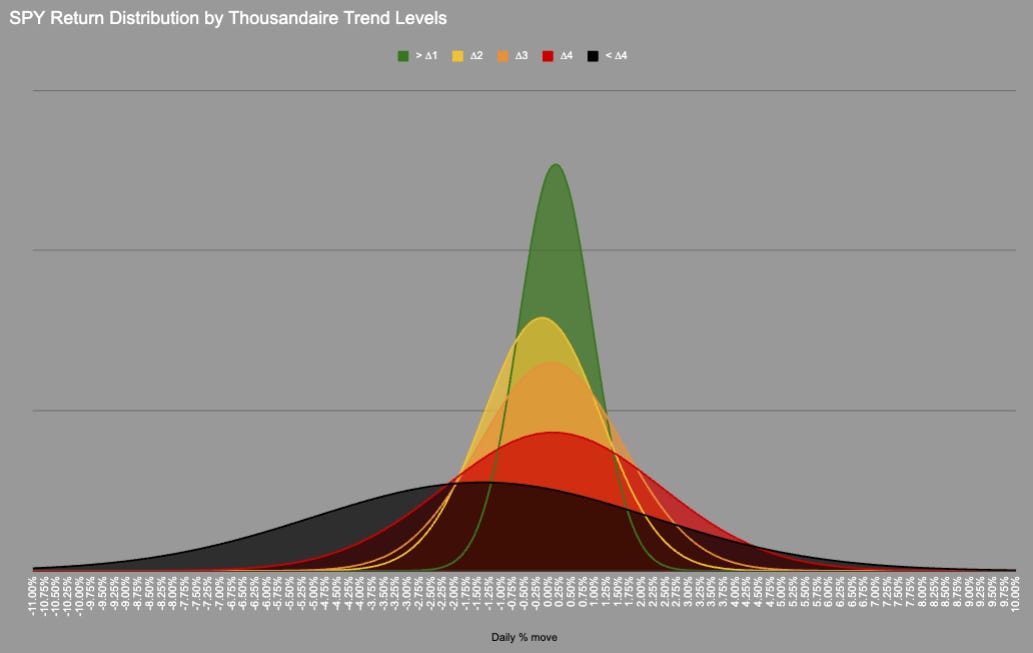
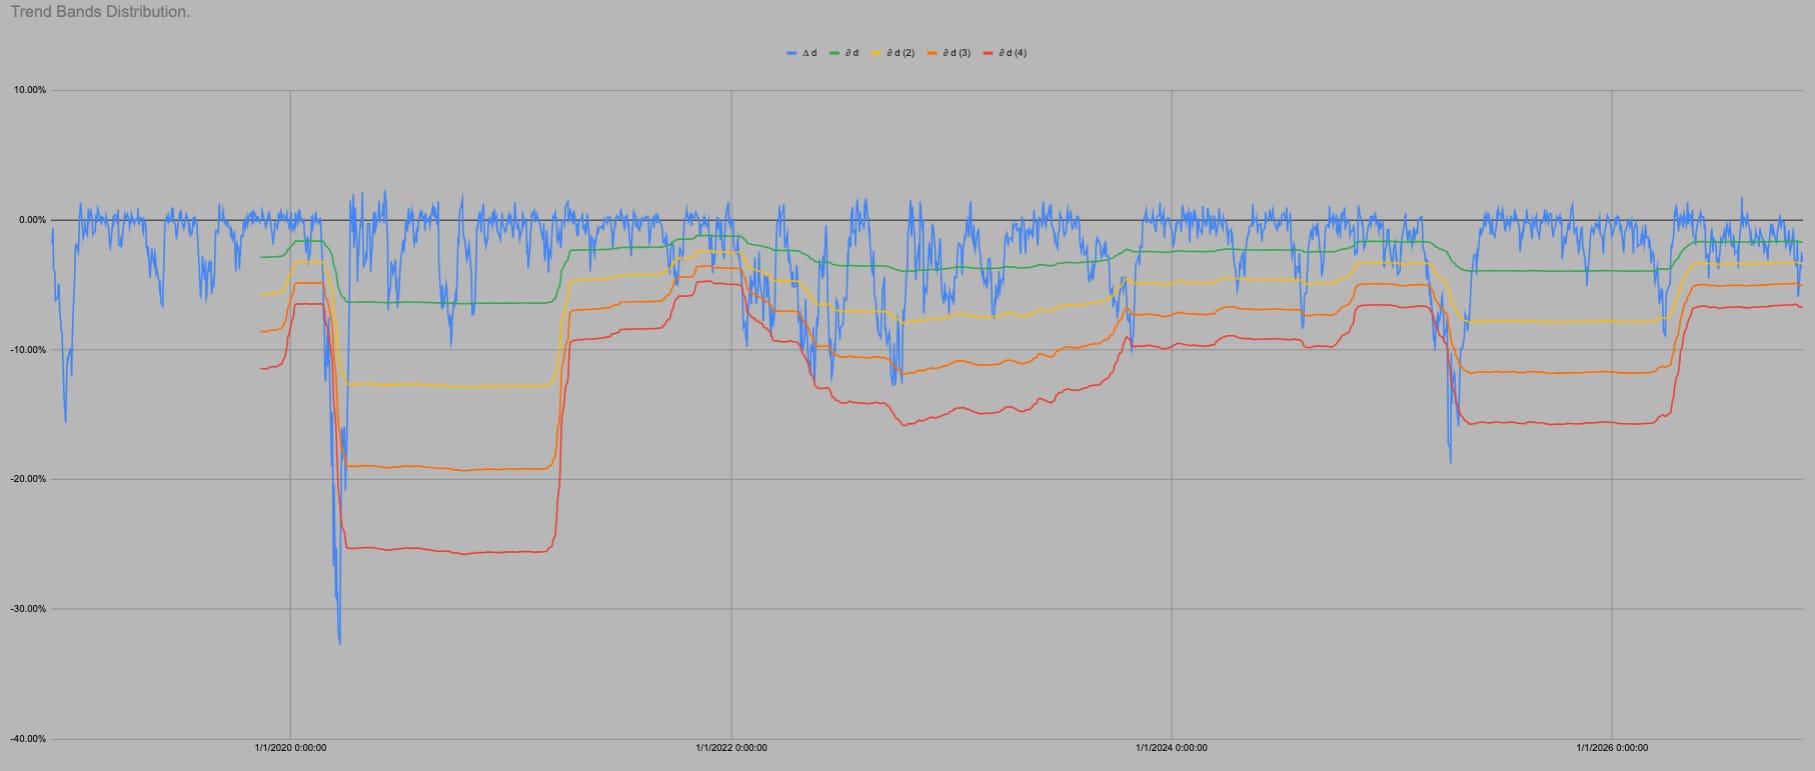
We could probably include orange as the distribution is very similar, but we need a transition point.
In 1761 trading days price has never moved directly from Green into Red/Black there is always an intermezzo hangout in Orange.
KeepItSimpleSubstack

Hot Takes with Hank
Think pieces!