

I advise using the app/website as emails are often truncated due to images!
Get a life if you think I have any idea about that nonsense, but thanks for clicking the bait.
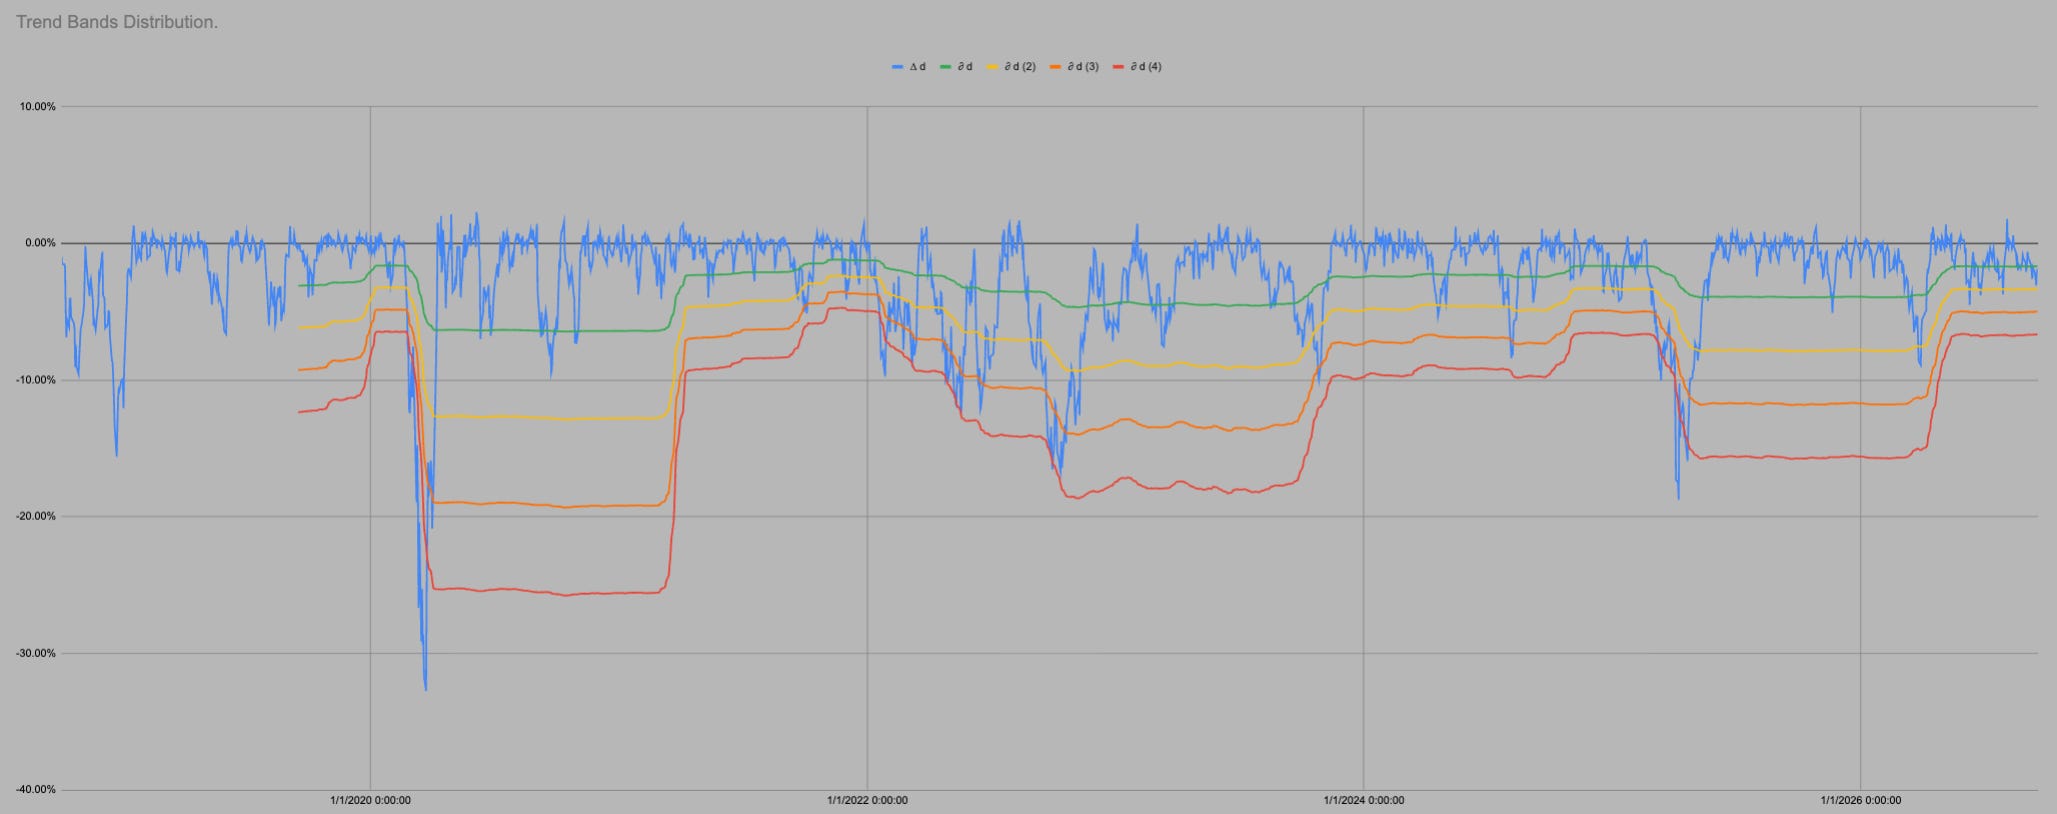
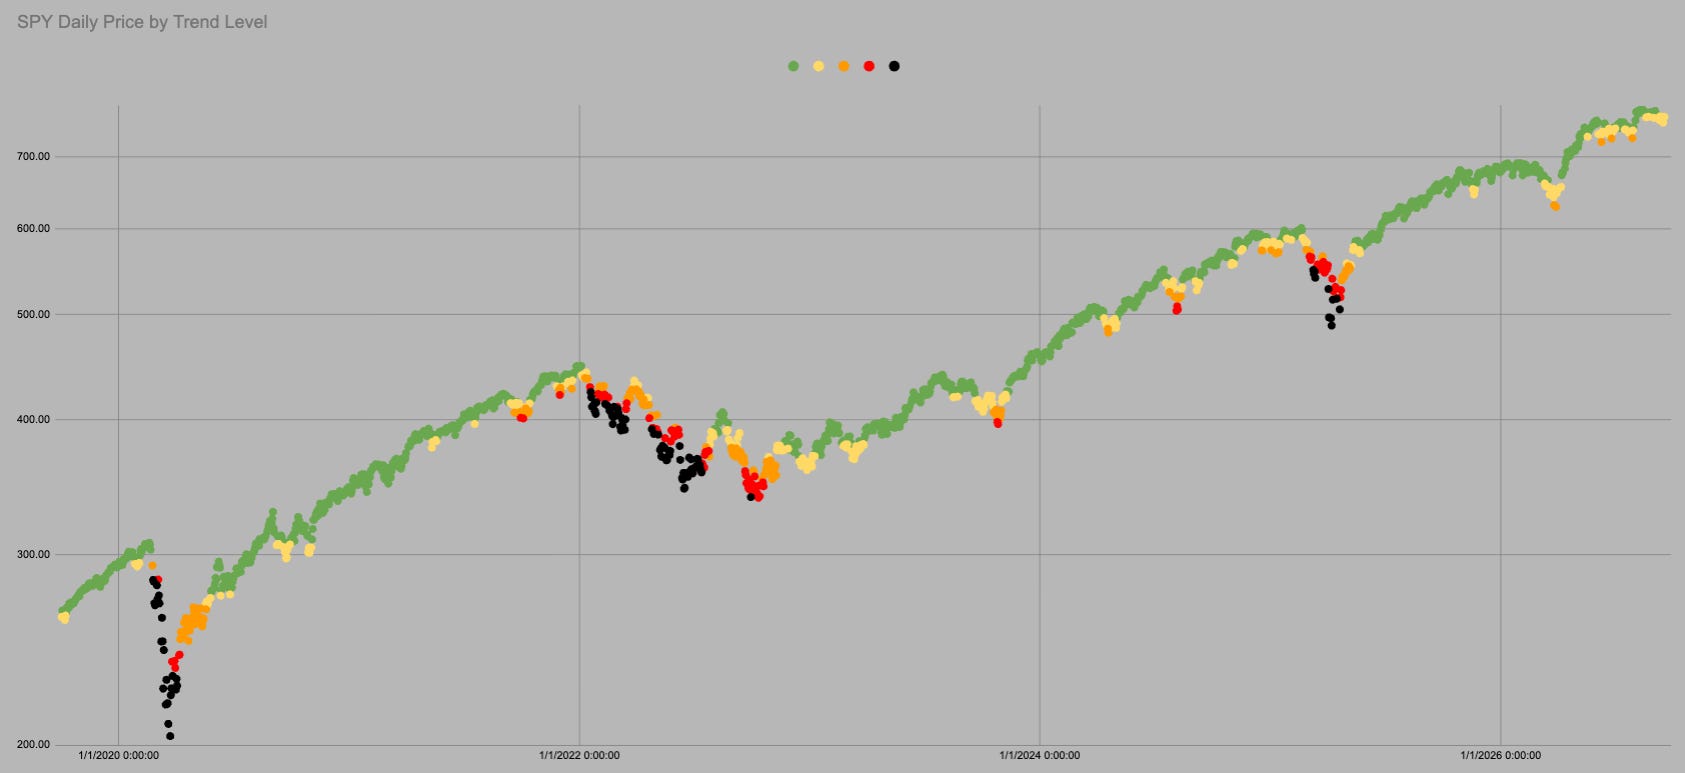
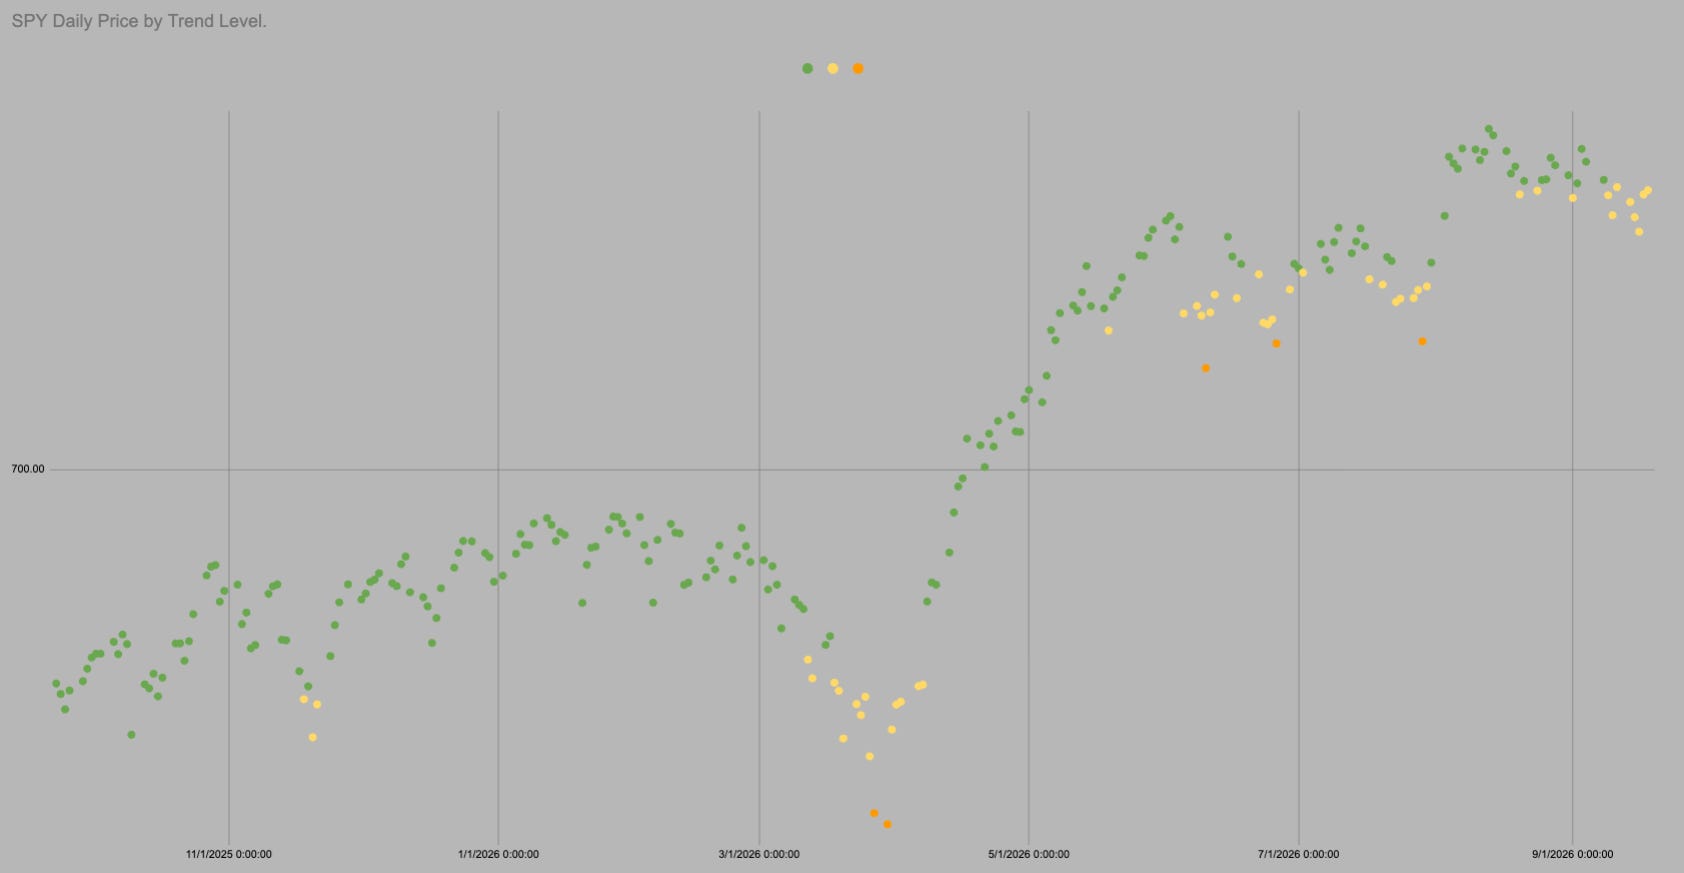
The dot is Yellow
Trend is 750.24
SPY spends 82% of all trading days above this level.
Its all cool beans.
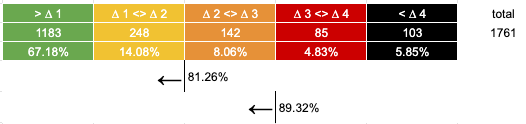
It is all the same chart so I can use all the same data. In the last 1761 trading days SPY has been above “trend” i.e. in green or yellow 82% of days.
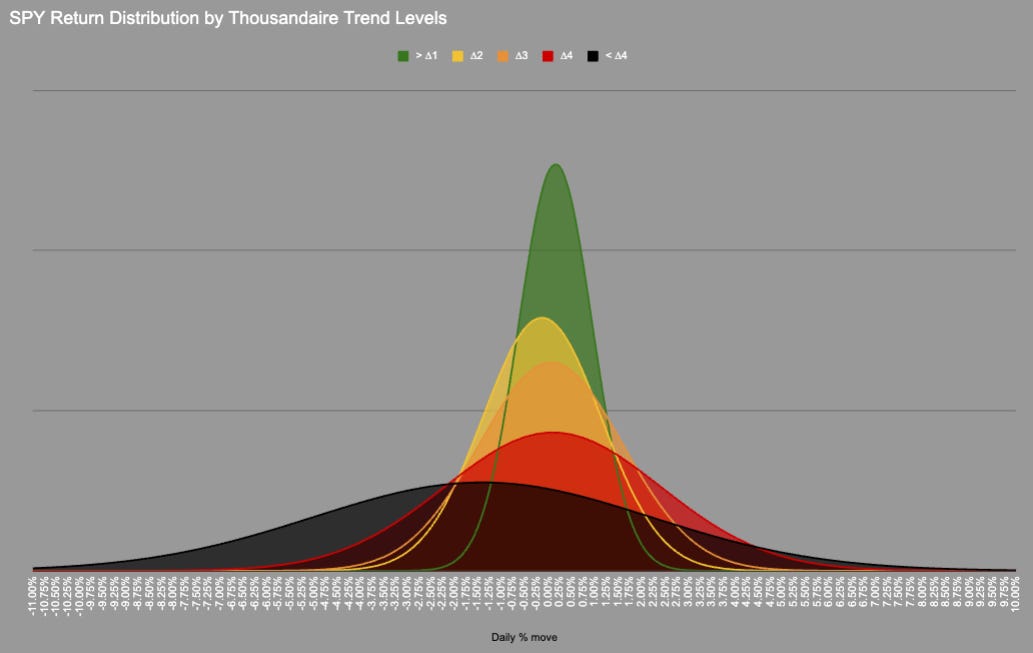
We could probably include orange as the distribution is very similar, but we need a transition point.
In 1761 trading days price has never moved directly from Green into Red/Black there is always an intermezzo hangout in Orange.
KeepItSimpleSubstack

Hot Takes with Hank

Think pieces!


