

I advise using the app/website as emails are often truncated due to images!
TL;DR
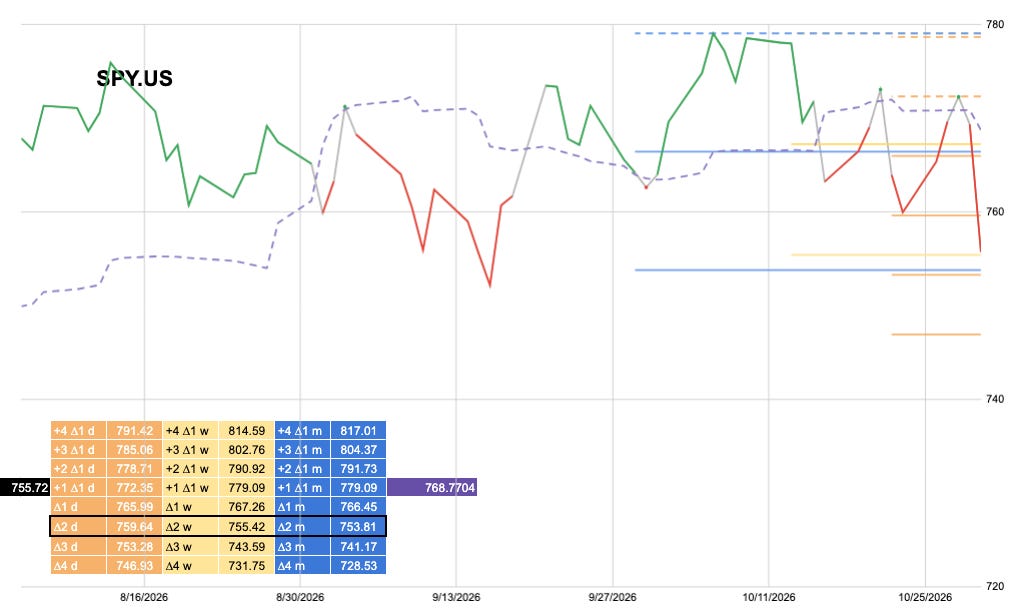
The dot is Yellow
Trend is 753.81
From last week has anything changed?
SPY made a run at trend and didn’t break.
So if like me you are just trying to get big moves right in places where you have the most money 401k, Pension, ISA, SIPP {insert country specific savings scheme here} etc
SPY, VOO etc is -3.31% away from its last all time high which was 25 days ago.
Let’s not freak out! I am sure a big move is coming and no doubt “the noos” will be turned up to 11 at the minute.
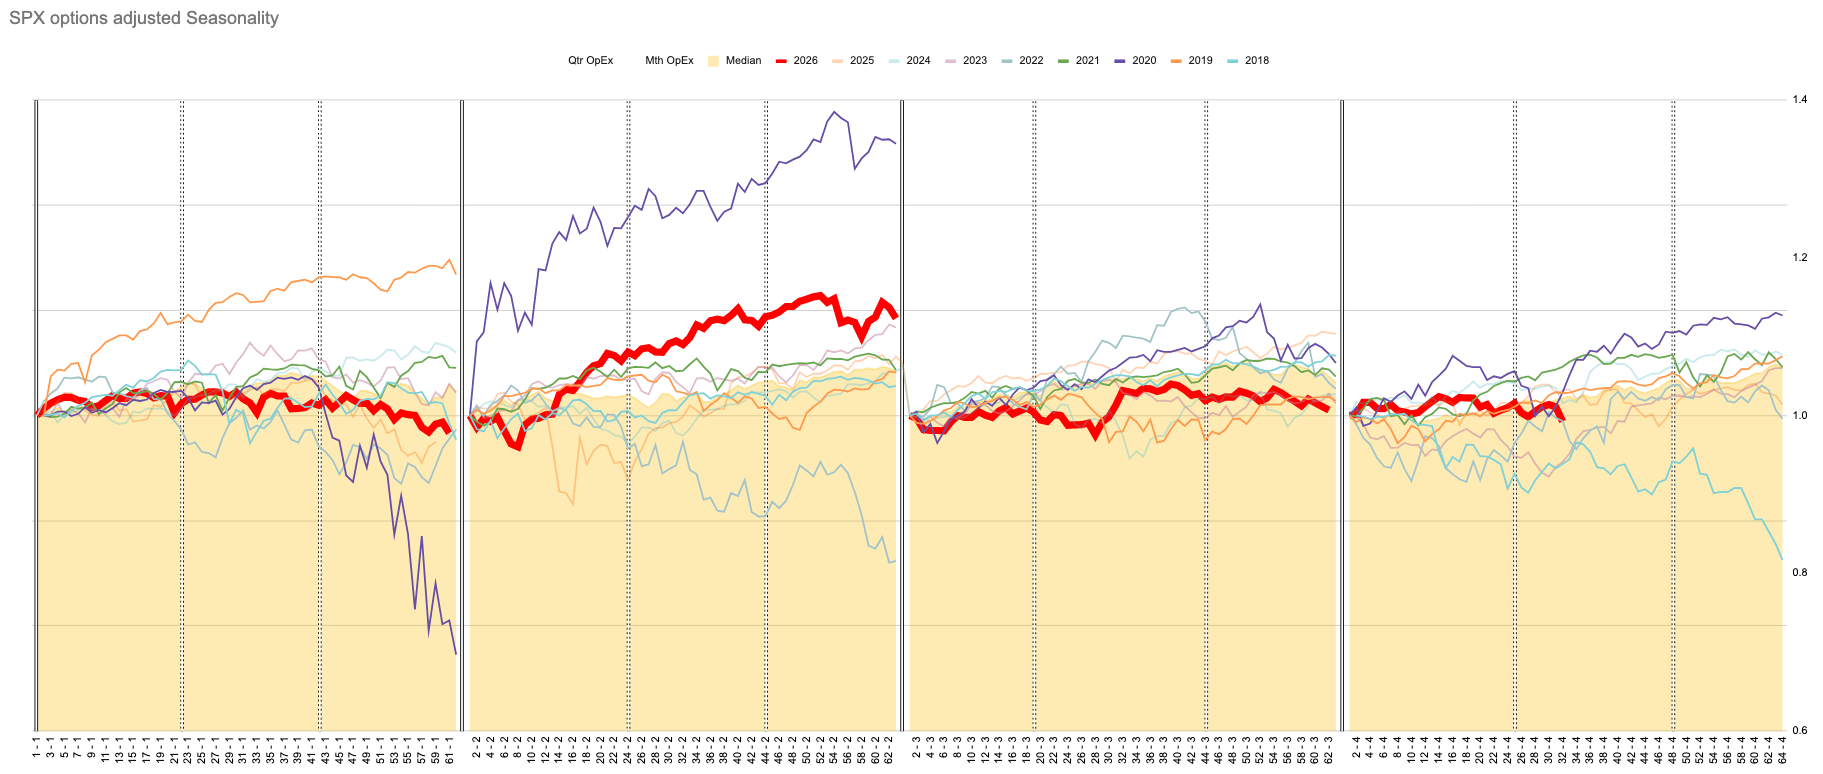
Let’s bring a chart in front of the paywall. 2018 was the last year to break down into the close of the year. I know many will say what about 1917 or 1854 or the great Pharaoh revolt of BC 4088. To that I would say get a life. Really though things change, we cannot equate today I think even back to the 80’s or 90’s. If we were to go back to a time where 95% of daily trading volume was driven by people and not computers then maybe. Right now that is not the case…
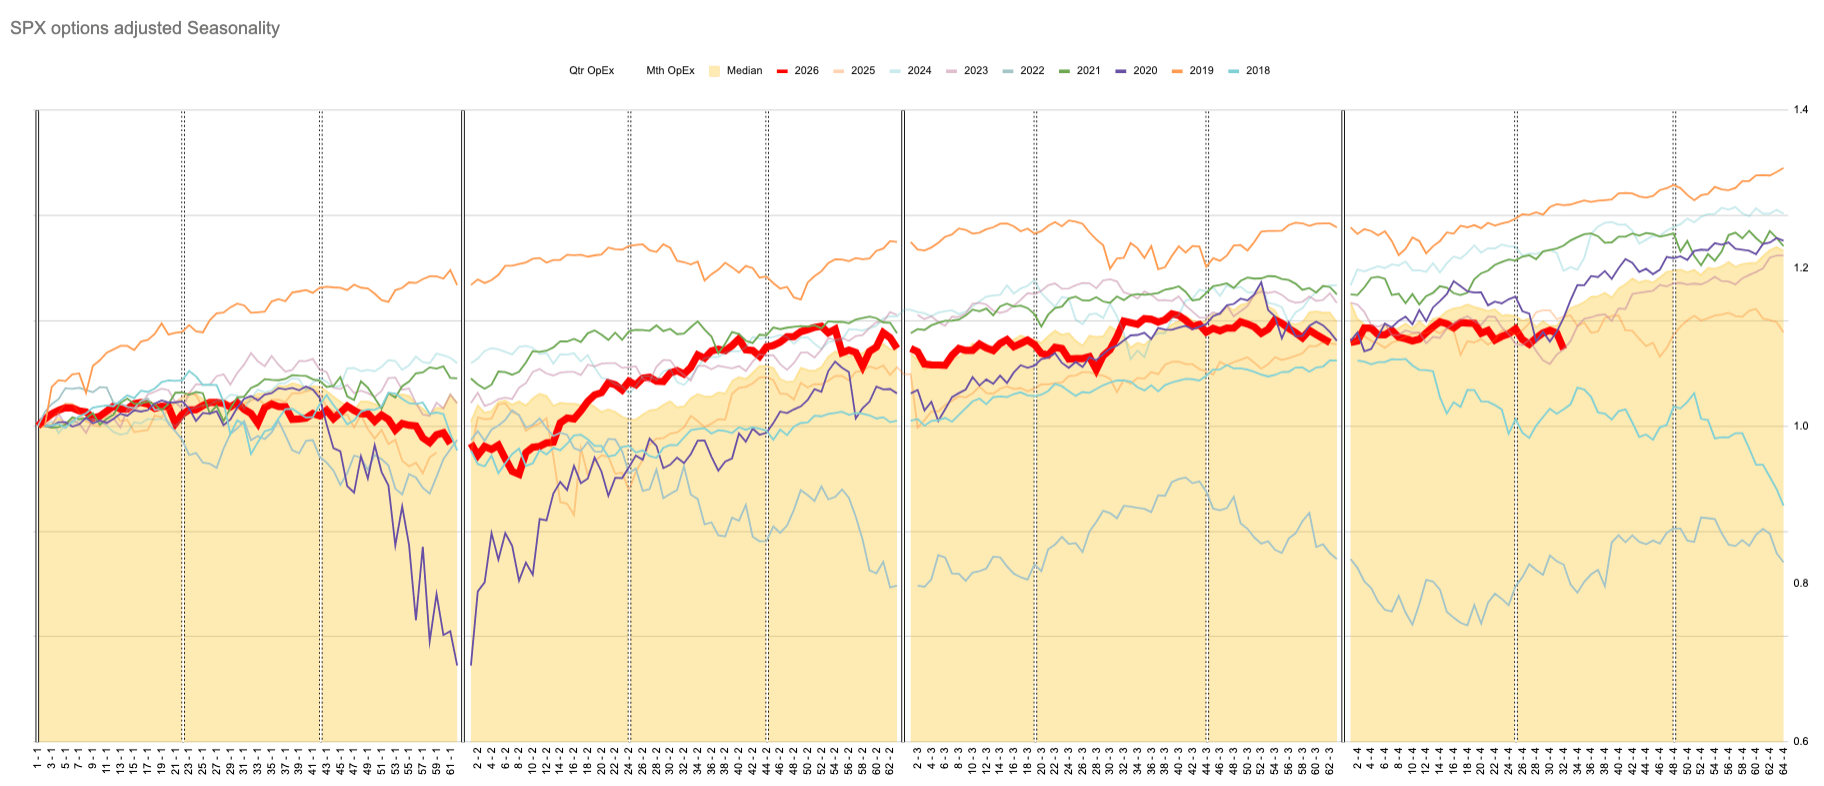
These dates are quarterly and monthly VIXperation dates. Even years like 2022 which was a poor year overall ended slightly better. This is not a balls to the wall everything will be going up go 200% long SP futures.
If 2026 turns out like 2018 and ends down -20% well then it will have to fall -0.27% and break trend.
Of course I would love everyday to just be up and to the right making 1% gains everyday for nothing…
Alas that is not the reality we have right now.
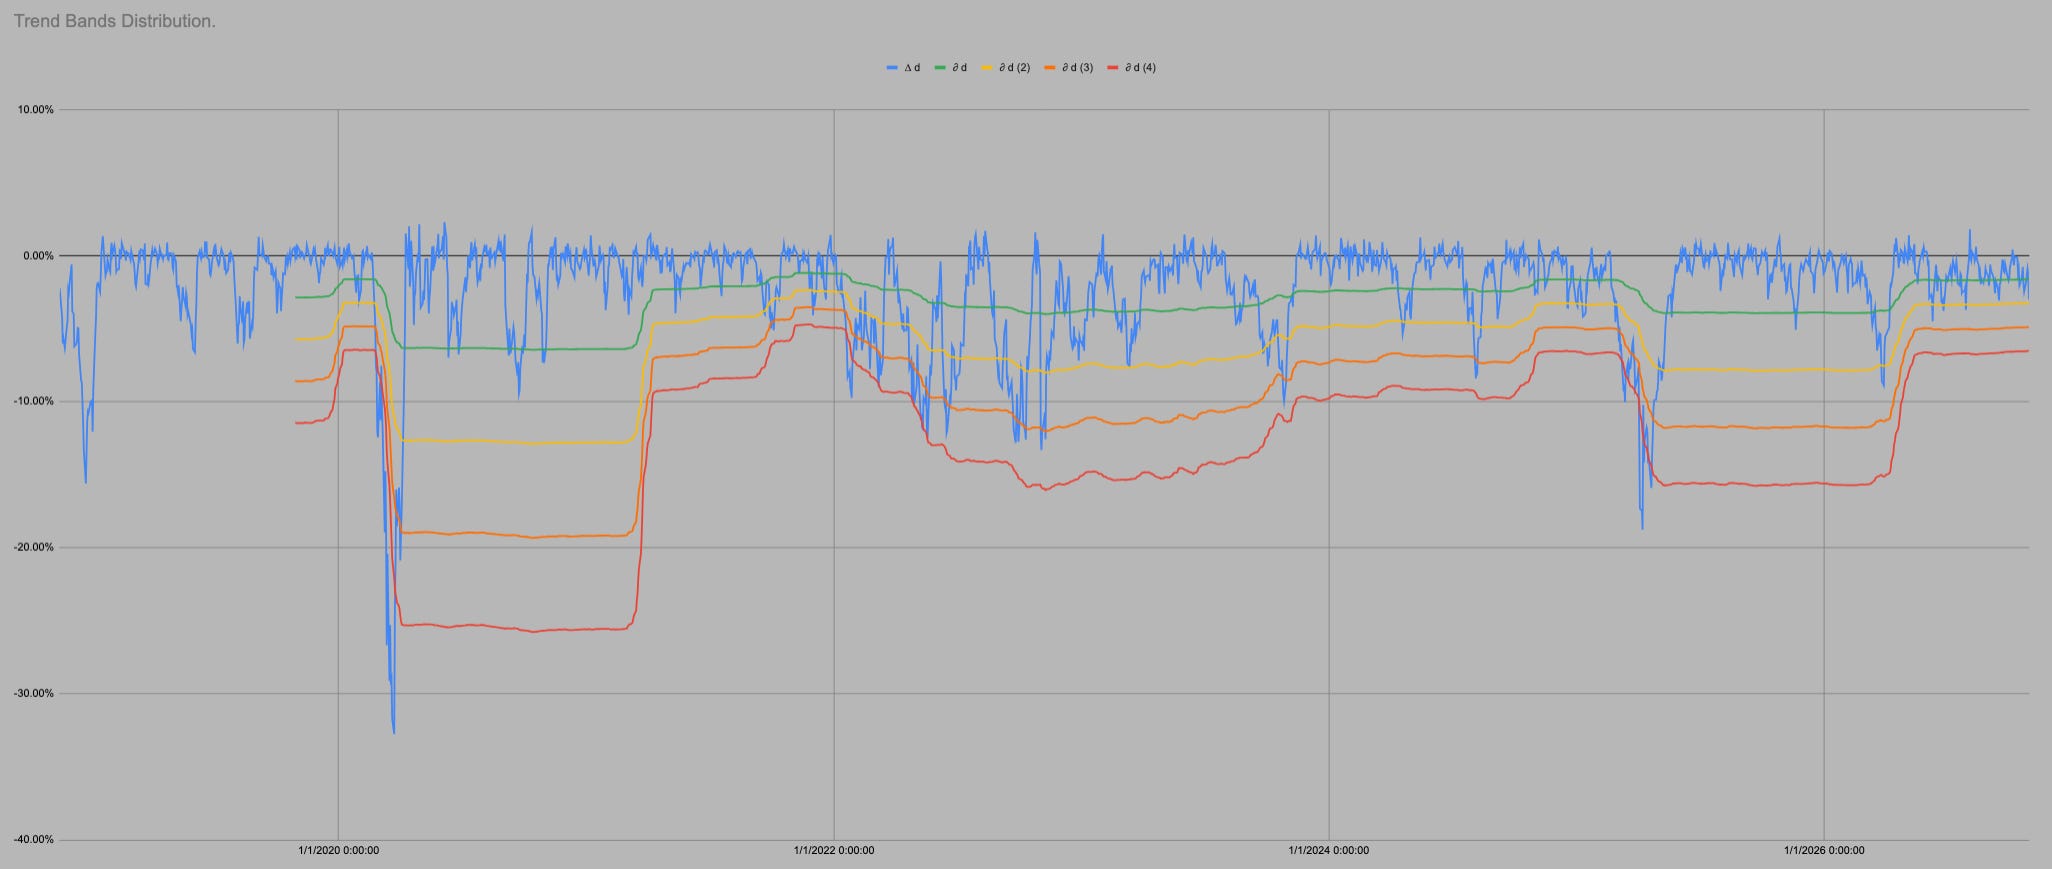
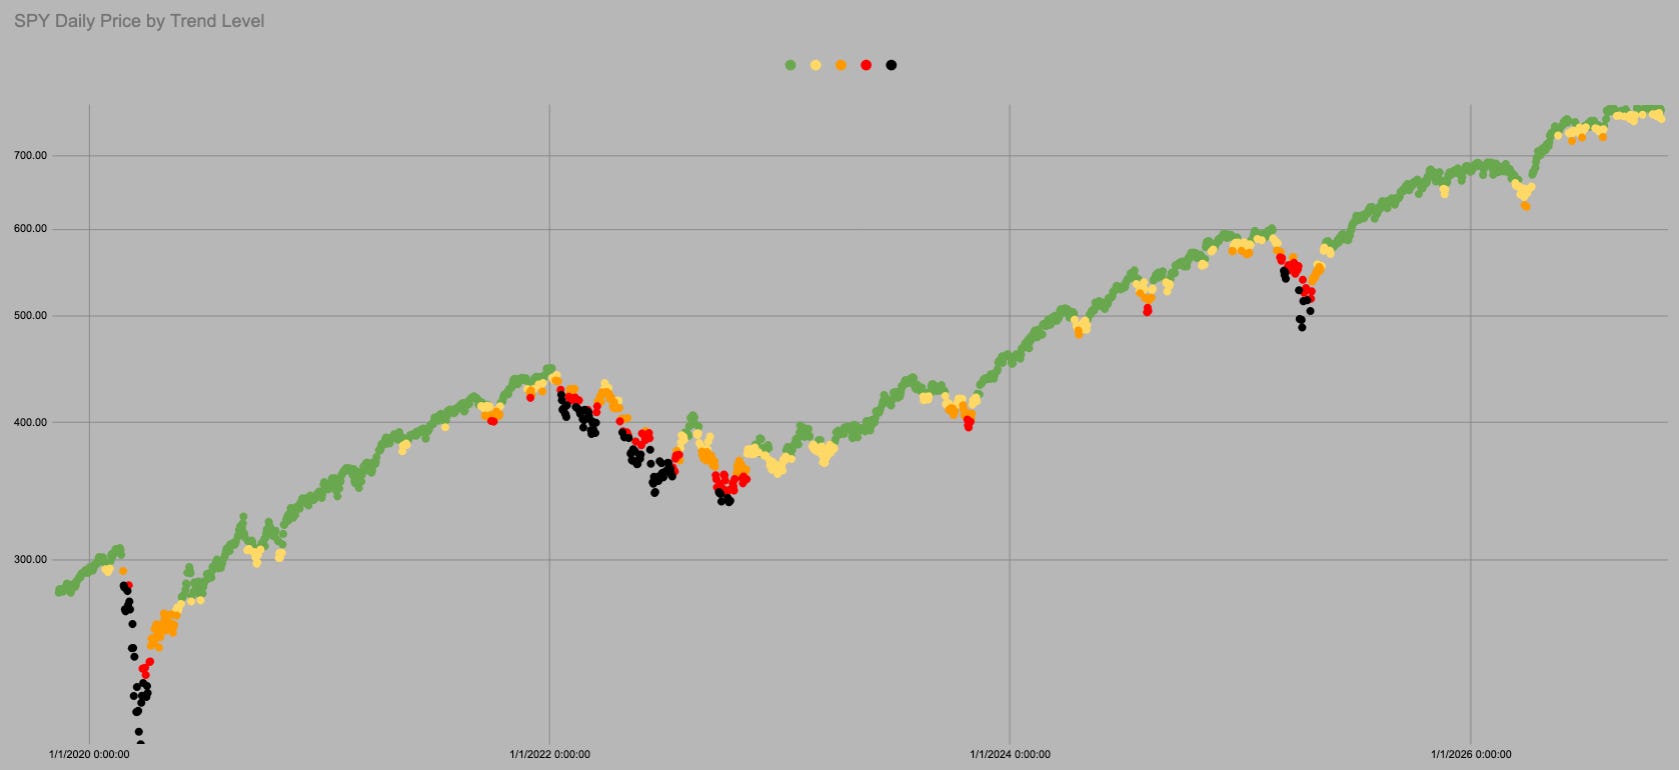
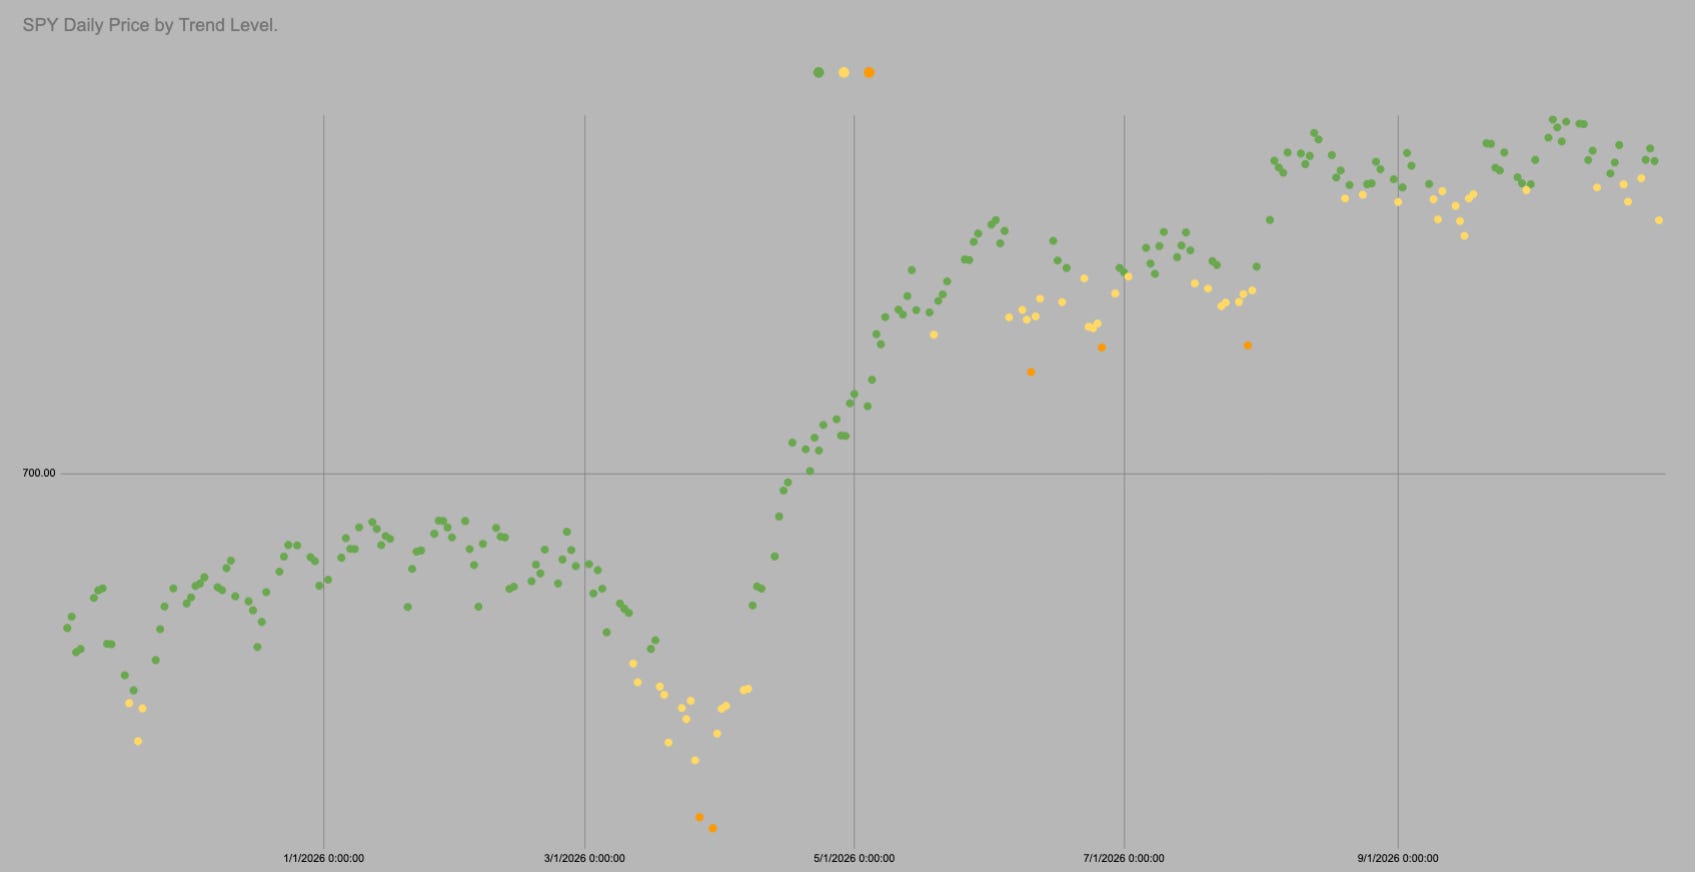
The dot is Yellow
Trend is 753.81
SPY spends 82% of all trading days above this level.
Its all cool beans.

It is all the same chart so I can use all the same data. In the last 1761 trading days SPY has been above “trend” i.e. in green or yellow 81% of days.
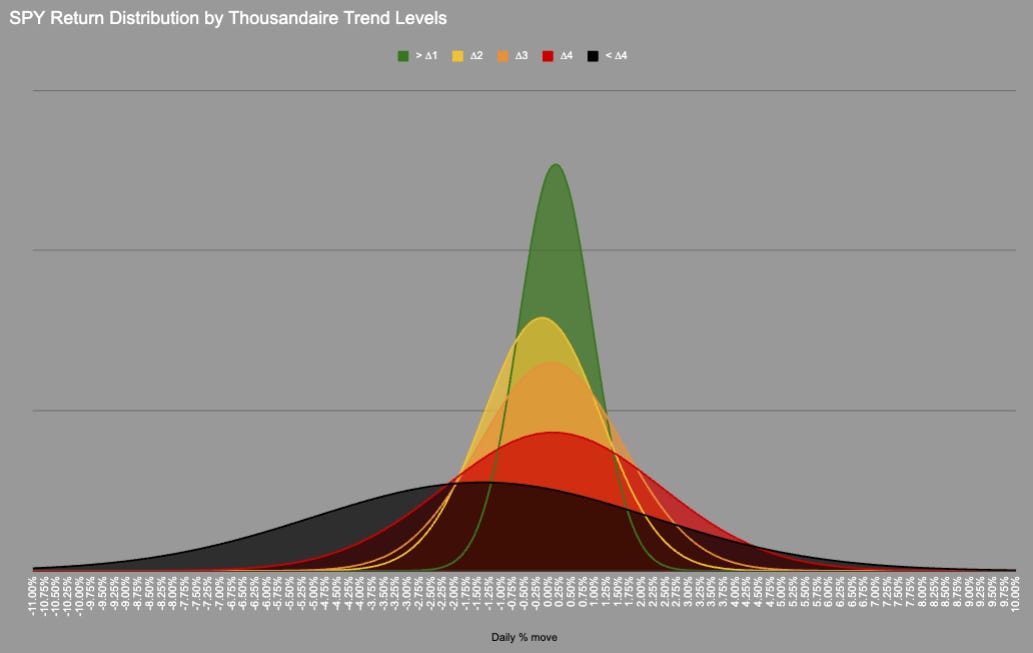
We could probably include orange as the distribution is very similar, but we need a transition point.
In 1761 trading days price has never moved directly from Green into Red/Black there is always an intermezzo hangout in Orange.
KeepItSimpleSubstack

Hot Takes with Hank

Think pieces!


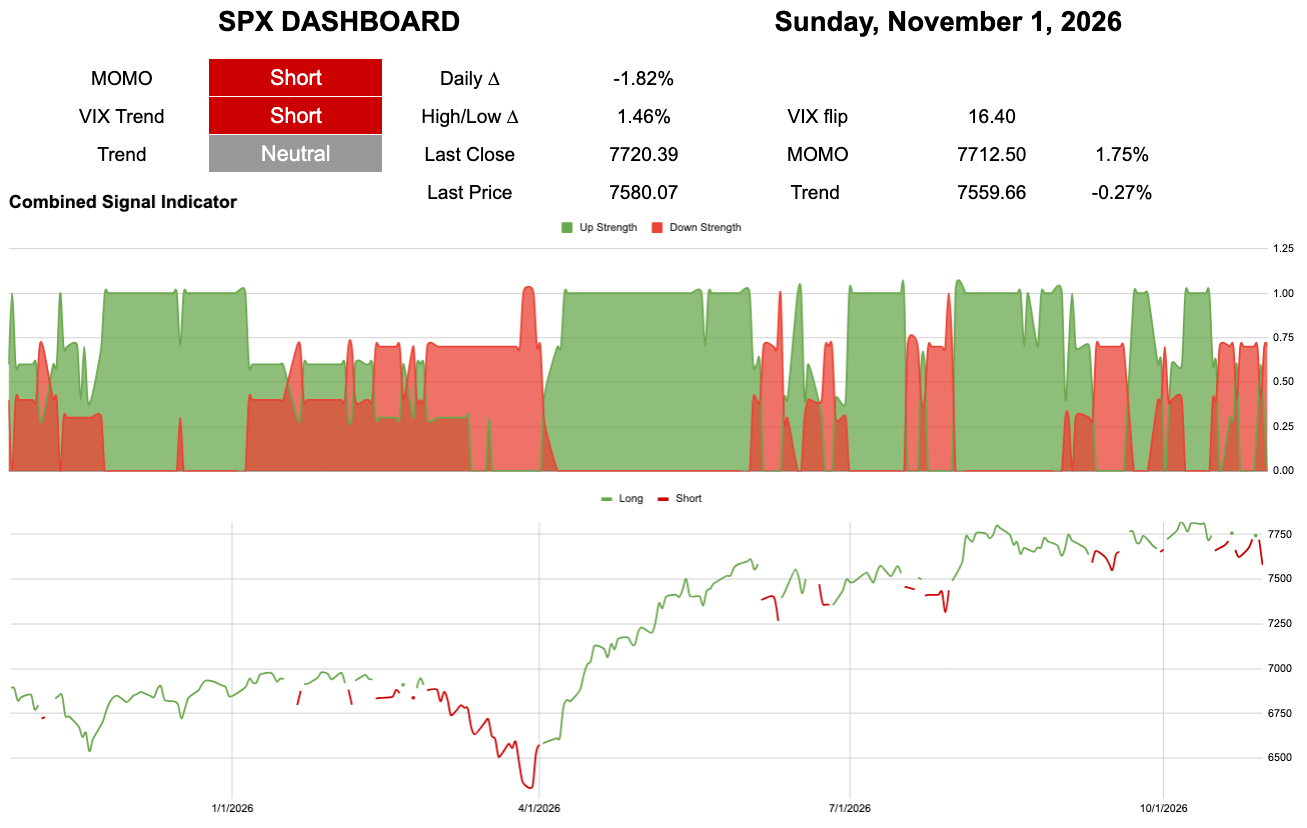
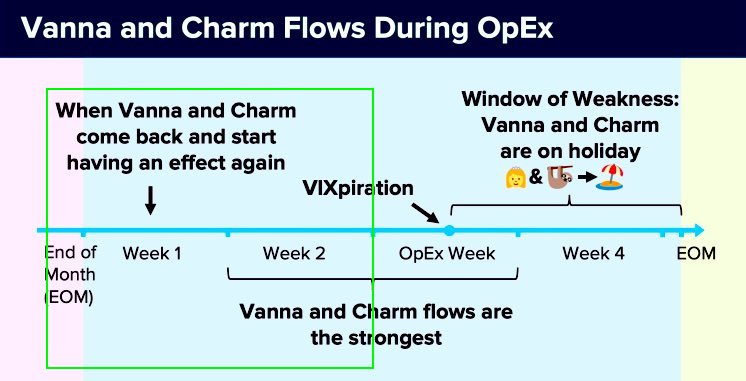
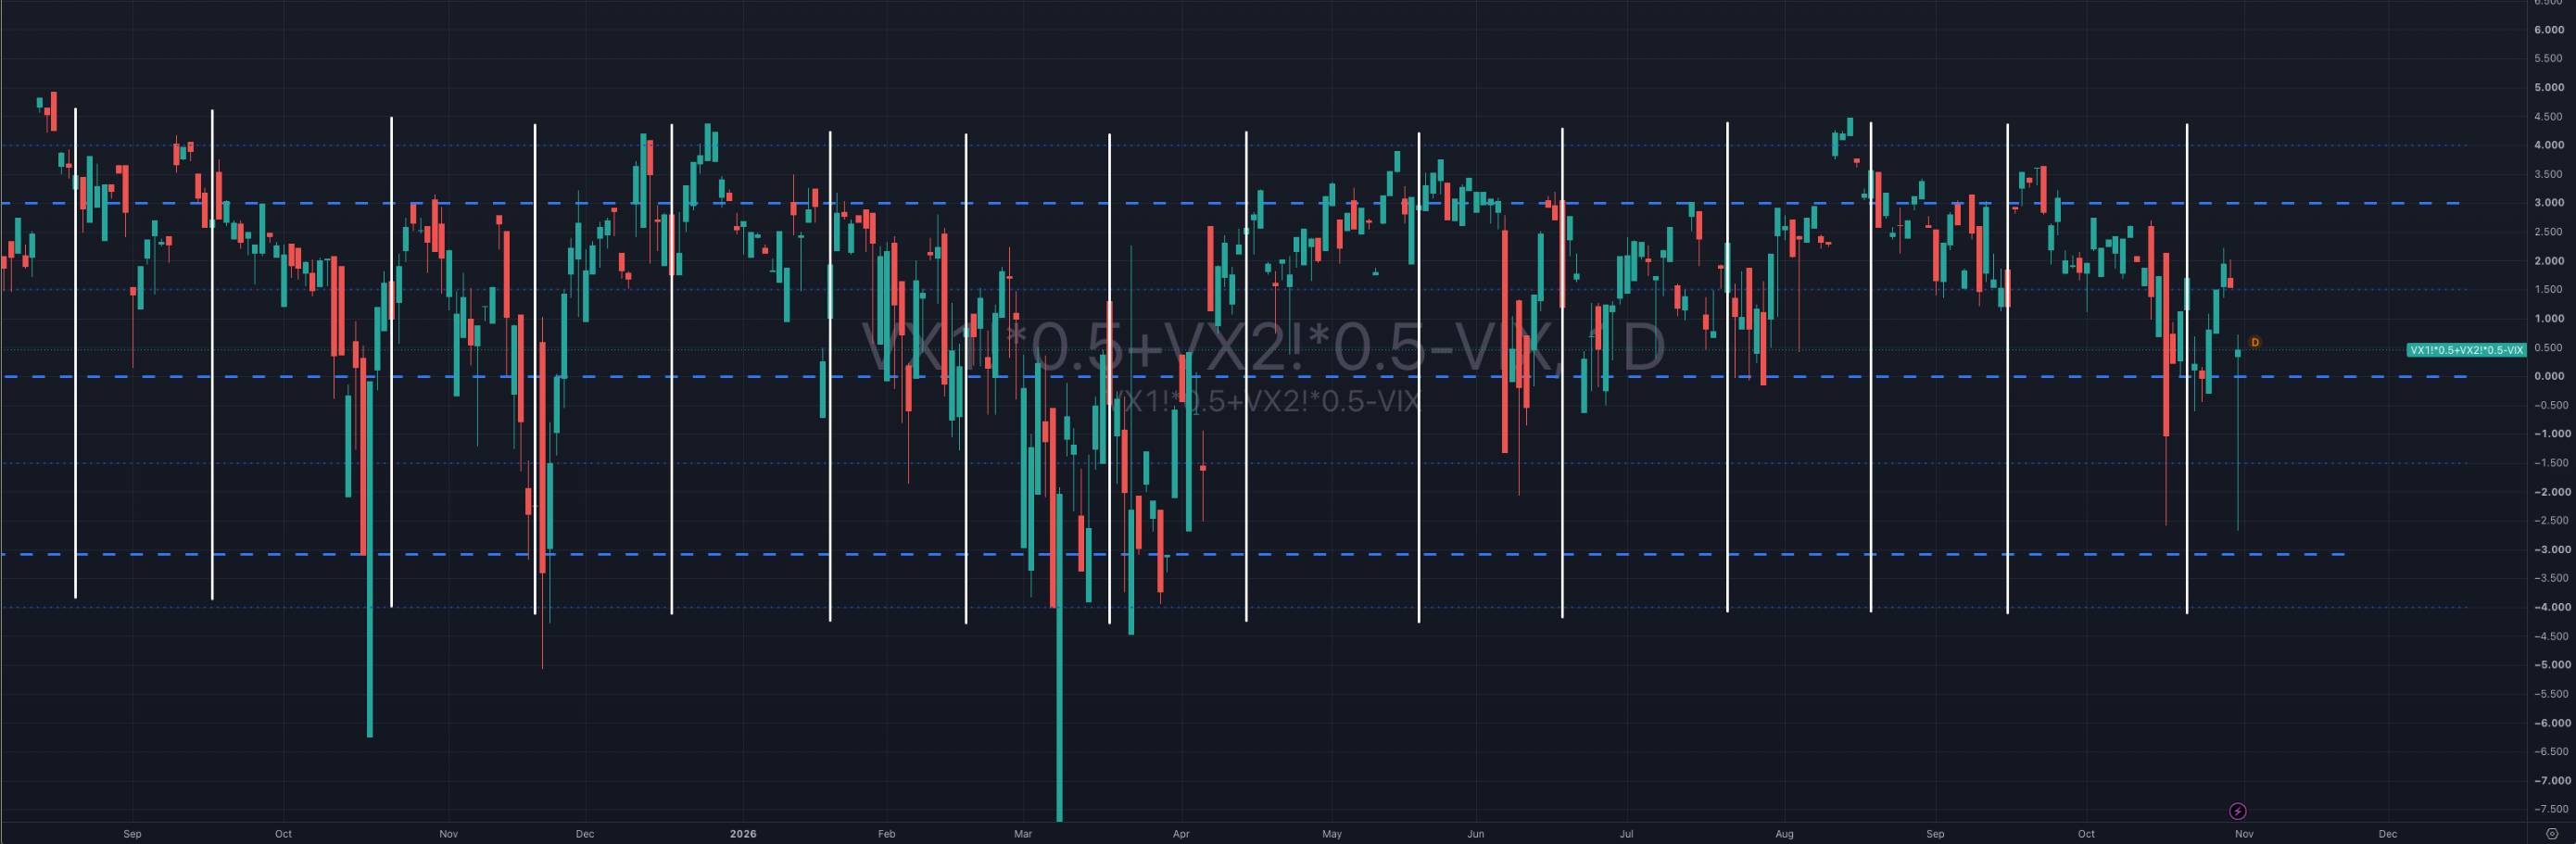
Could calamity be around the corner? Of course it can! Here is a chart of first and second month VIX contracts. Can it get worse? Yes! But it has already been pretty bad.
Again if we crash we have to break trend first.
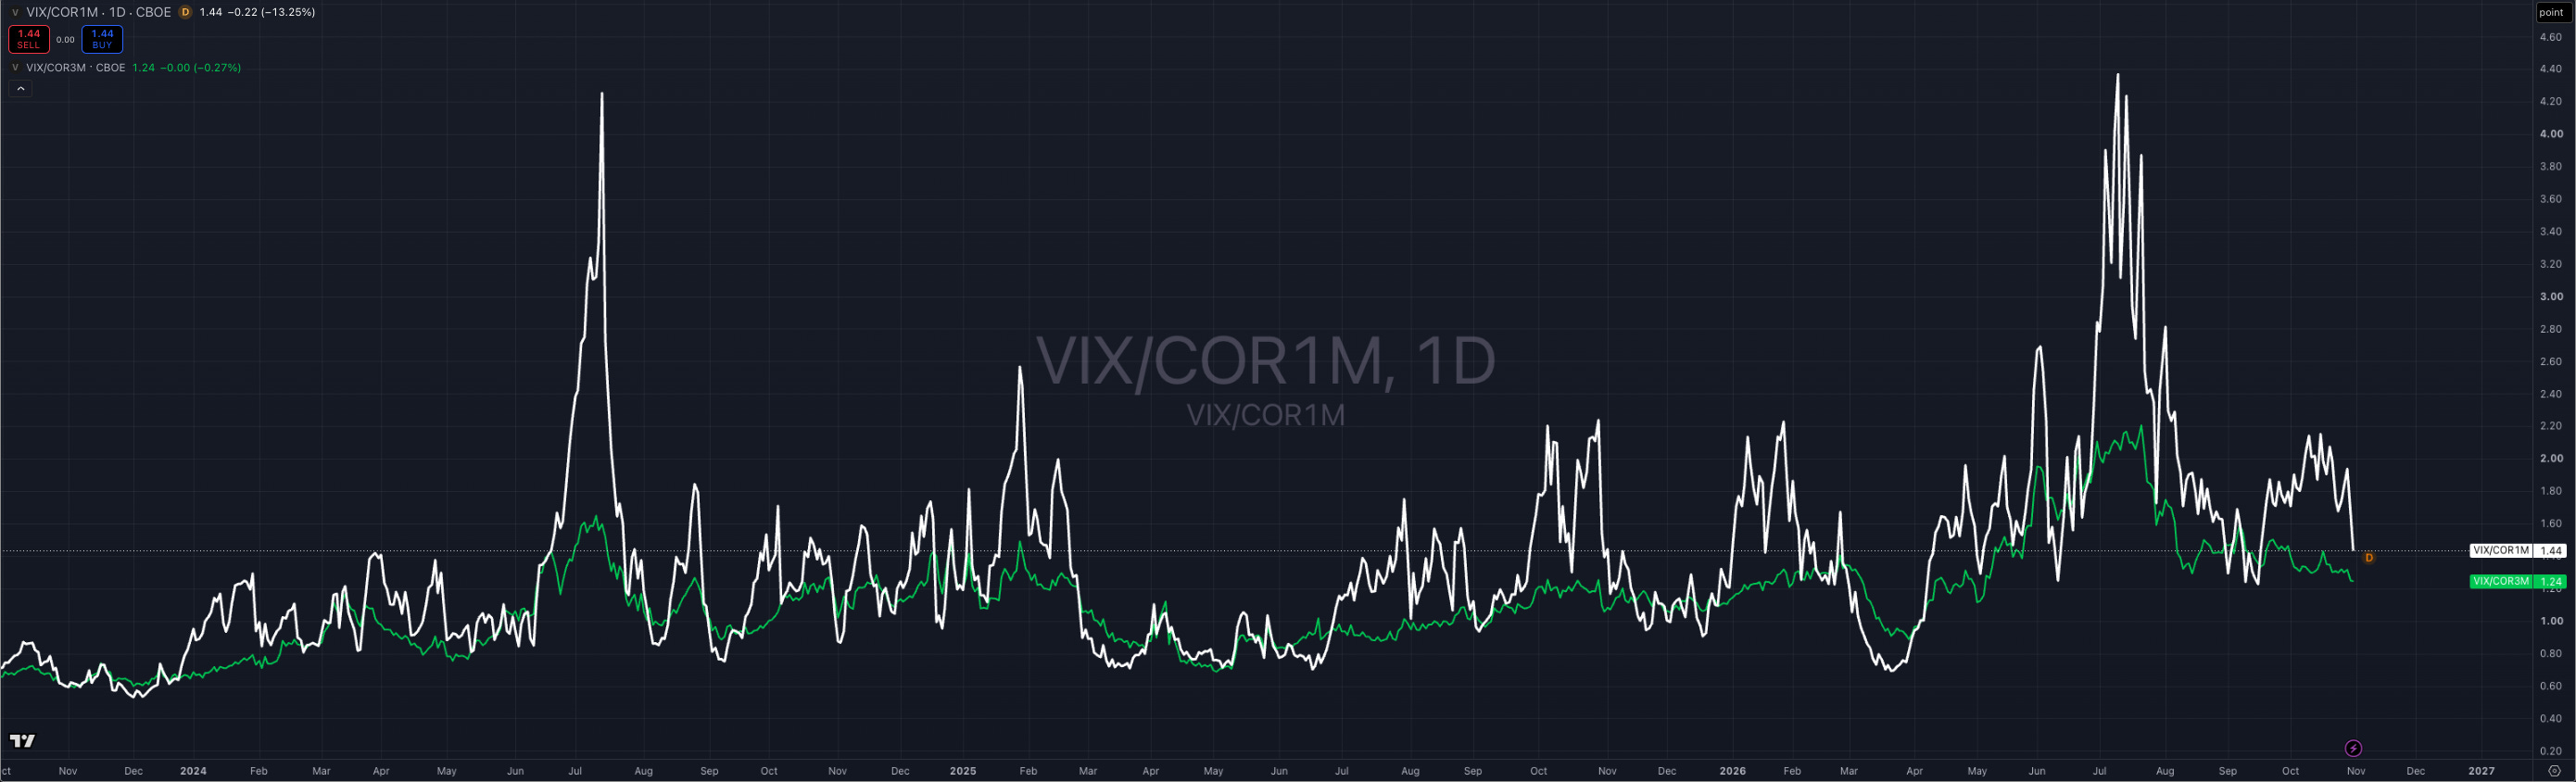
Can you remember all the talk about internal correlation through the summer? I can I think my brain is wired to remember financial bullshit and then highlight it to three people that still subscribe months later and say “see it wasn’t so scary after all”.
If everyone is scared of the doom outcomes, what if everything just gets a smidgen less shit? What if you have to take down some of your hedges? What if billions of dollars of long VIX trades need taken down?
When was the last time finance bros were right about something?
Imagine if SMH and all the other things that have sucked triggered a black line of doom right before the vote that is super hedged…
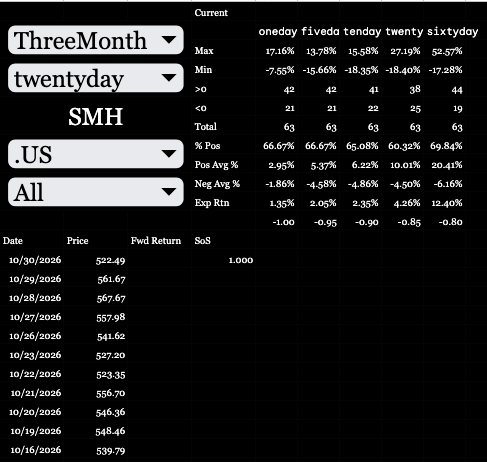
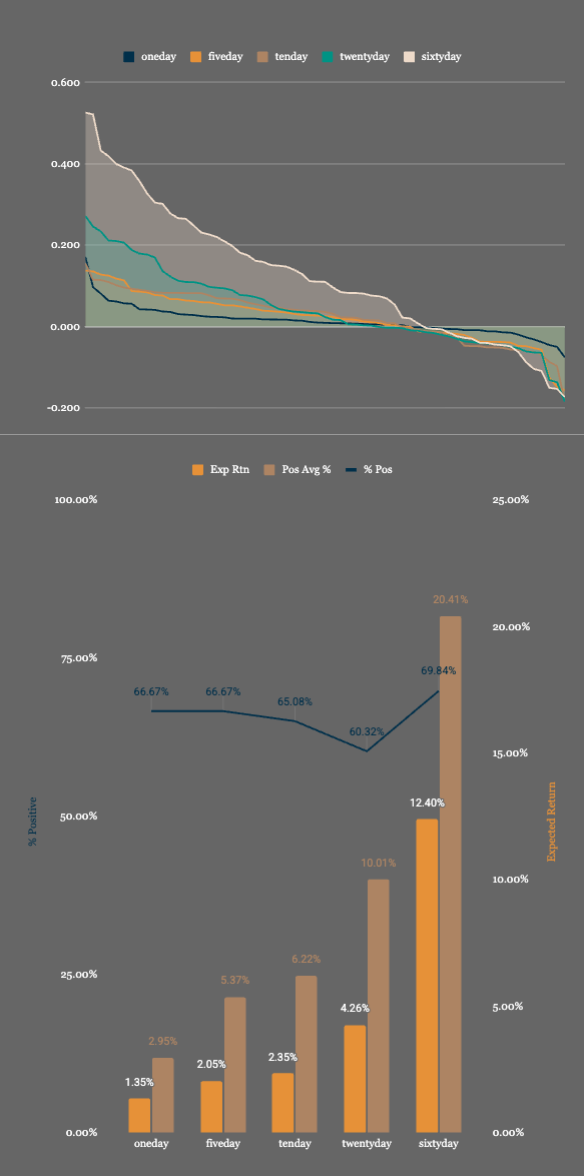
Imagine if “on average” that meant 60days forward returns were higher ~70% of the time, and the average return was +12.4%. If you are an options kinda guy/gal, long calls to expiry i.e. using only positive outcomes of SMH index were +20%.
With all the noise and nonsense going on, would you be ready for that?