

I advise using the app/website as emails are often truncated due to images!
TL;DR
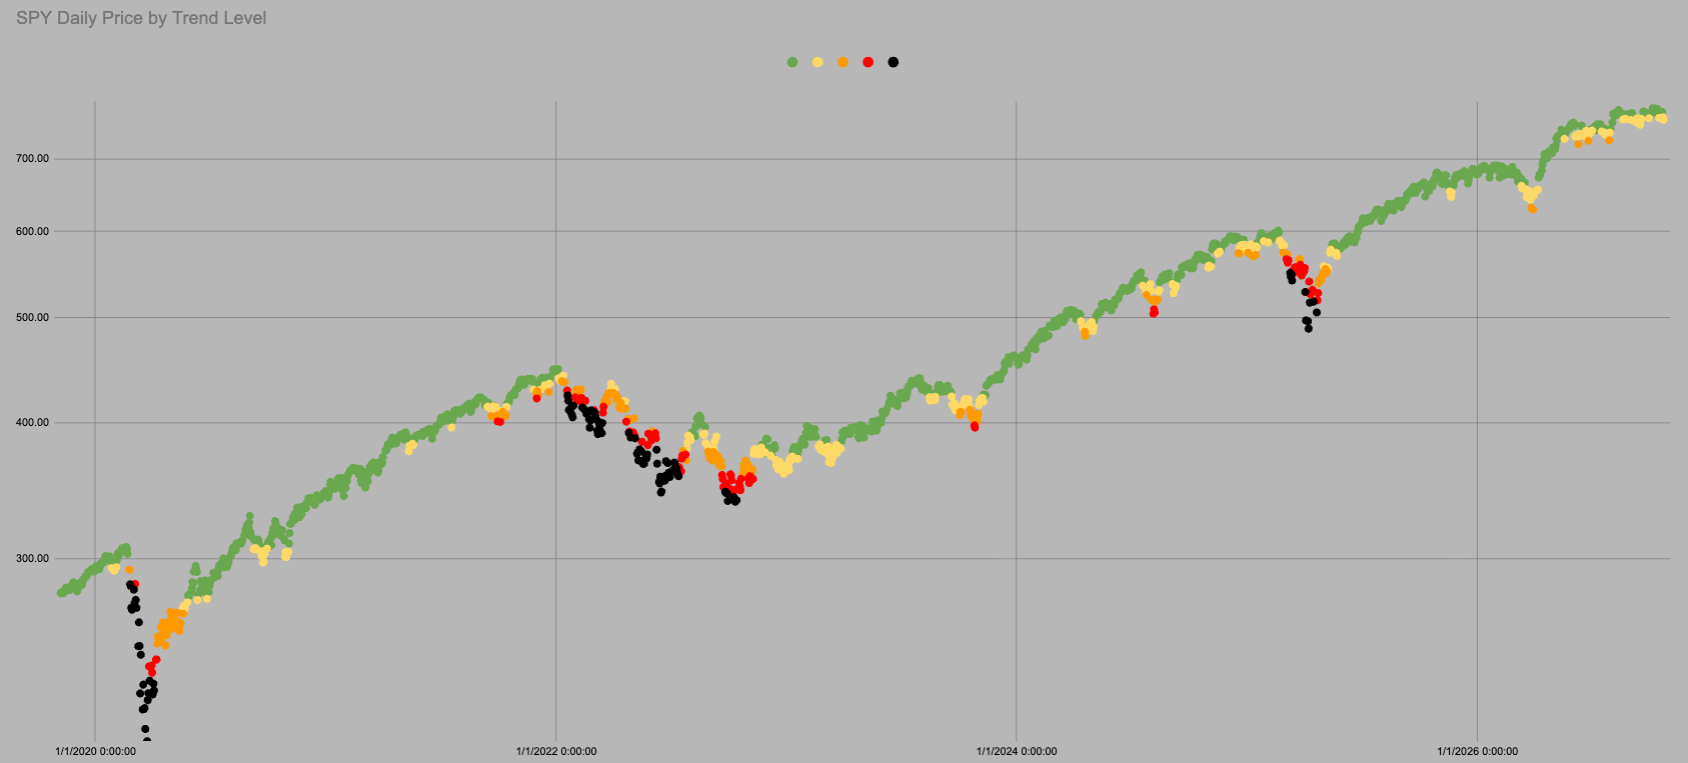
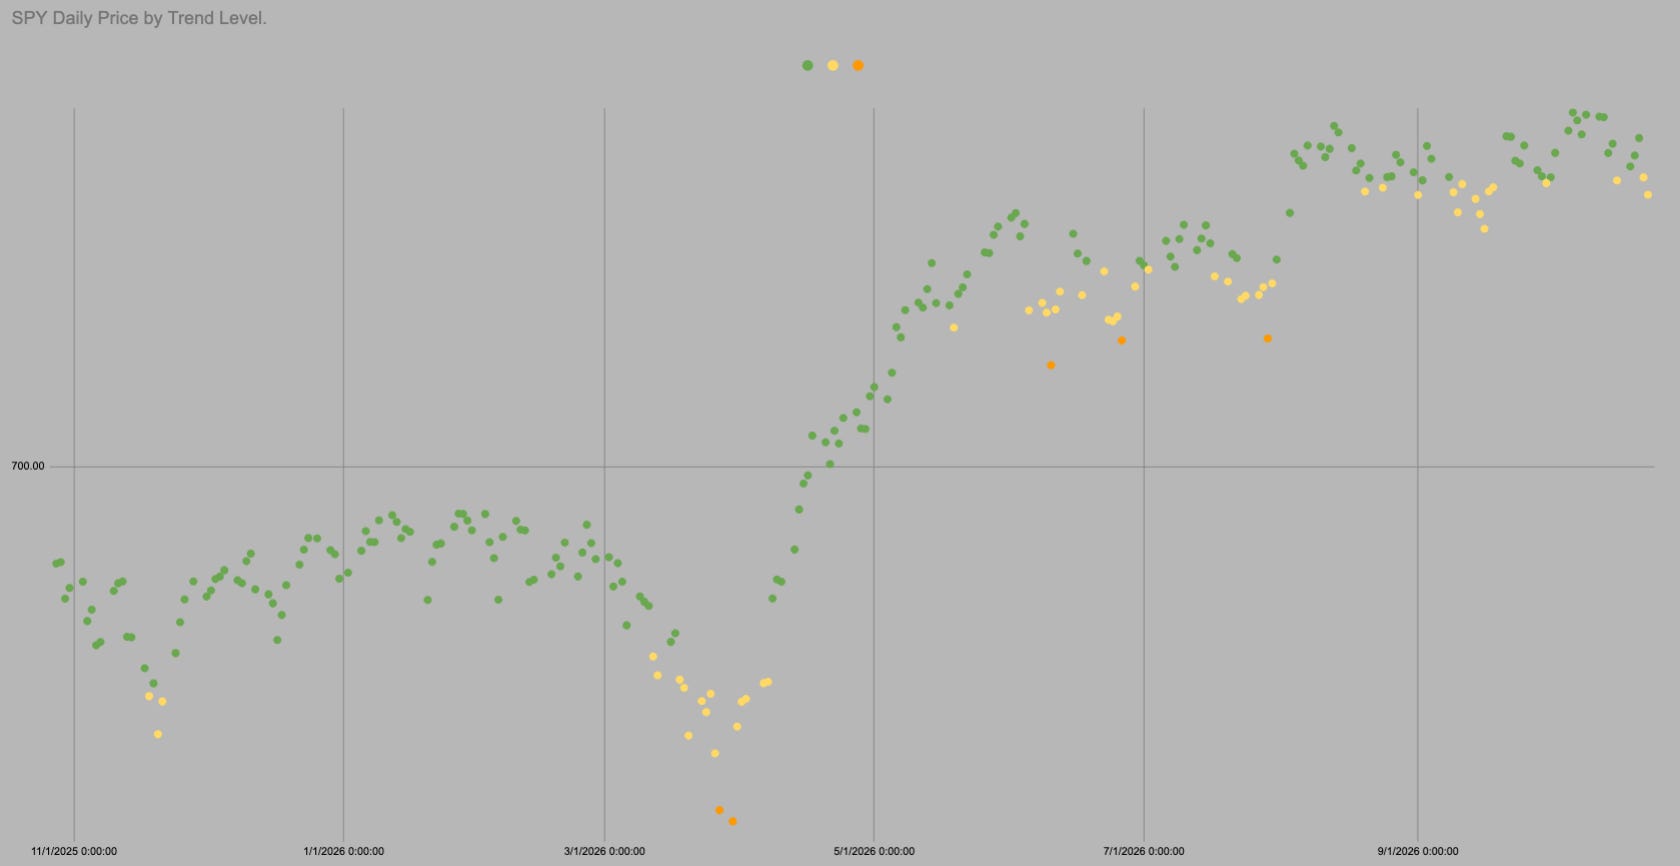
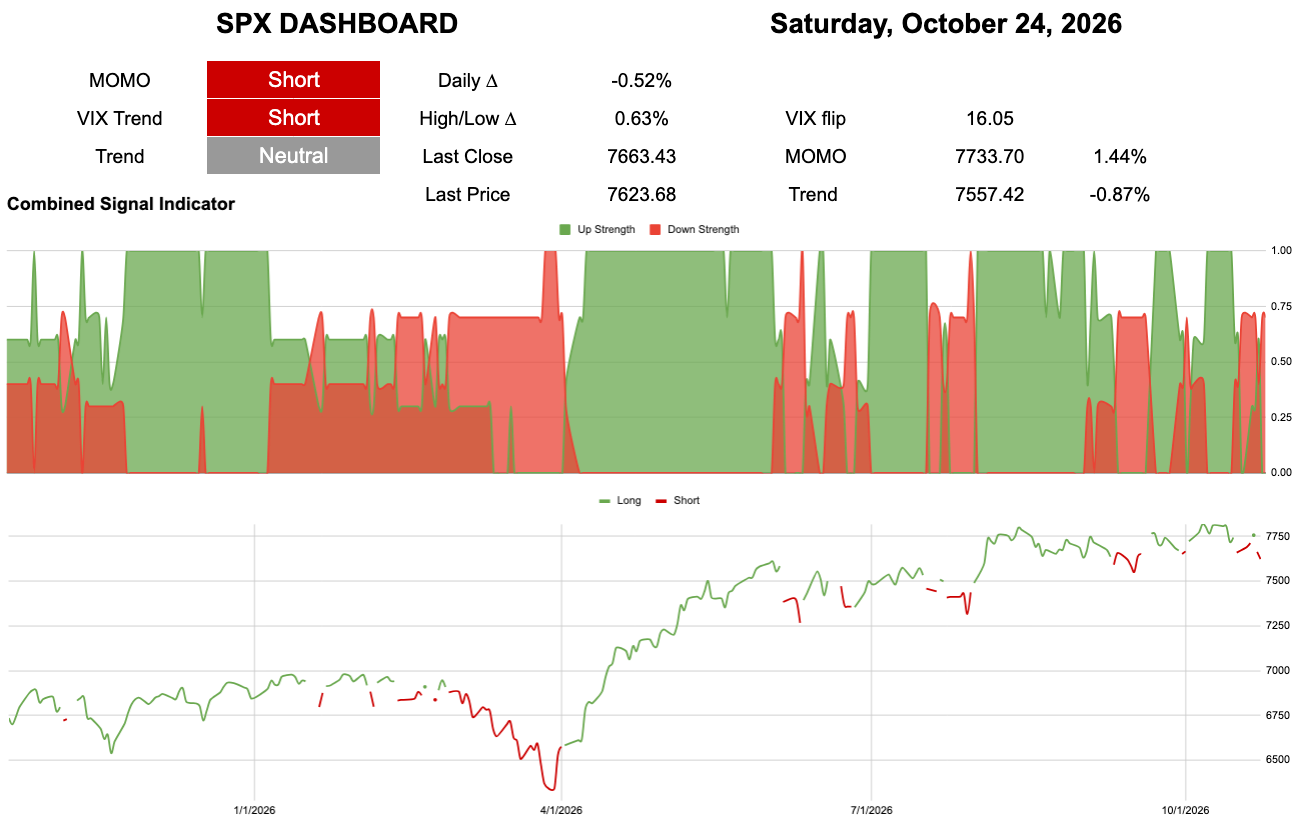
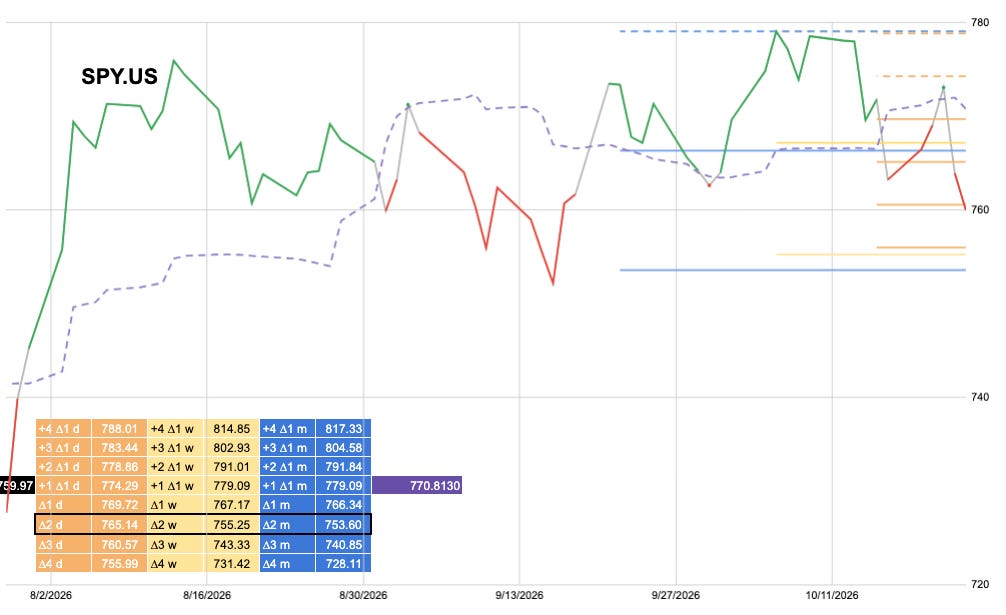
The dot is Yellow
Trend is 753.60
I am going to be incredibly naive, pig headed, dumb money and show just how much “I don’t get it”…
SPY is 2.47% away from an all time high it made 14 trading days ago.
That’s it really.
The dot is Yellow
Trend is 753.60
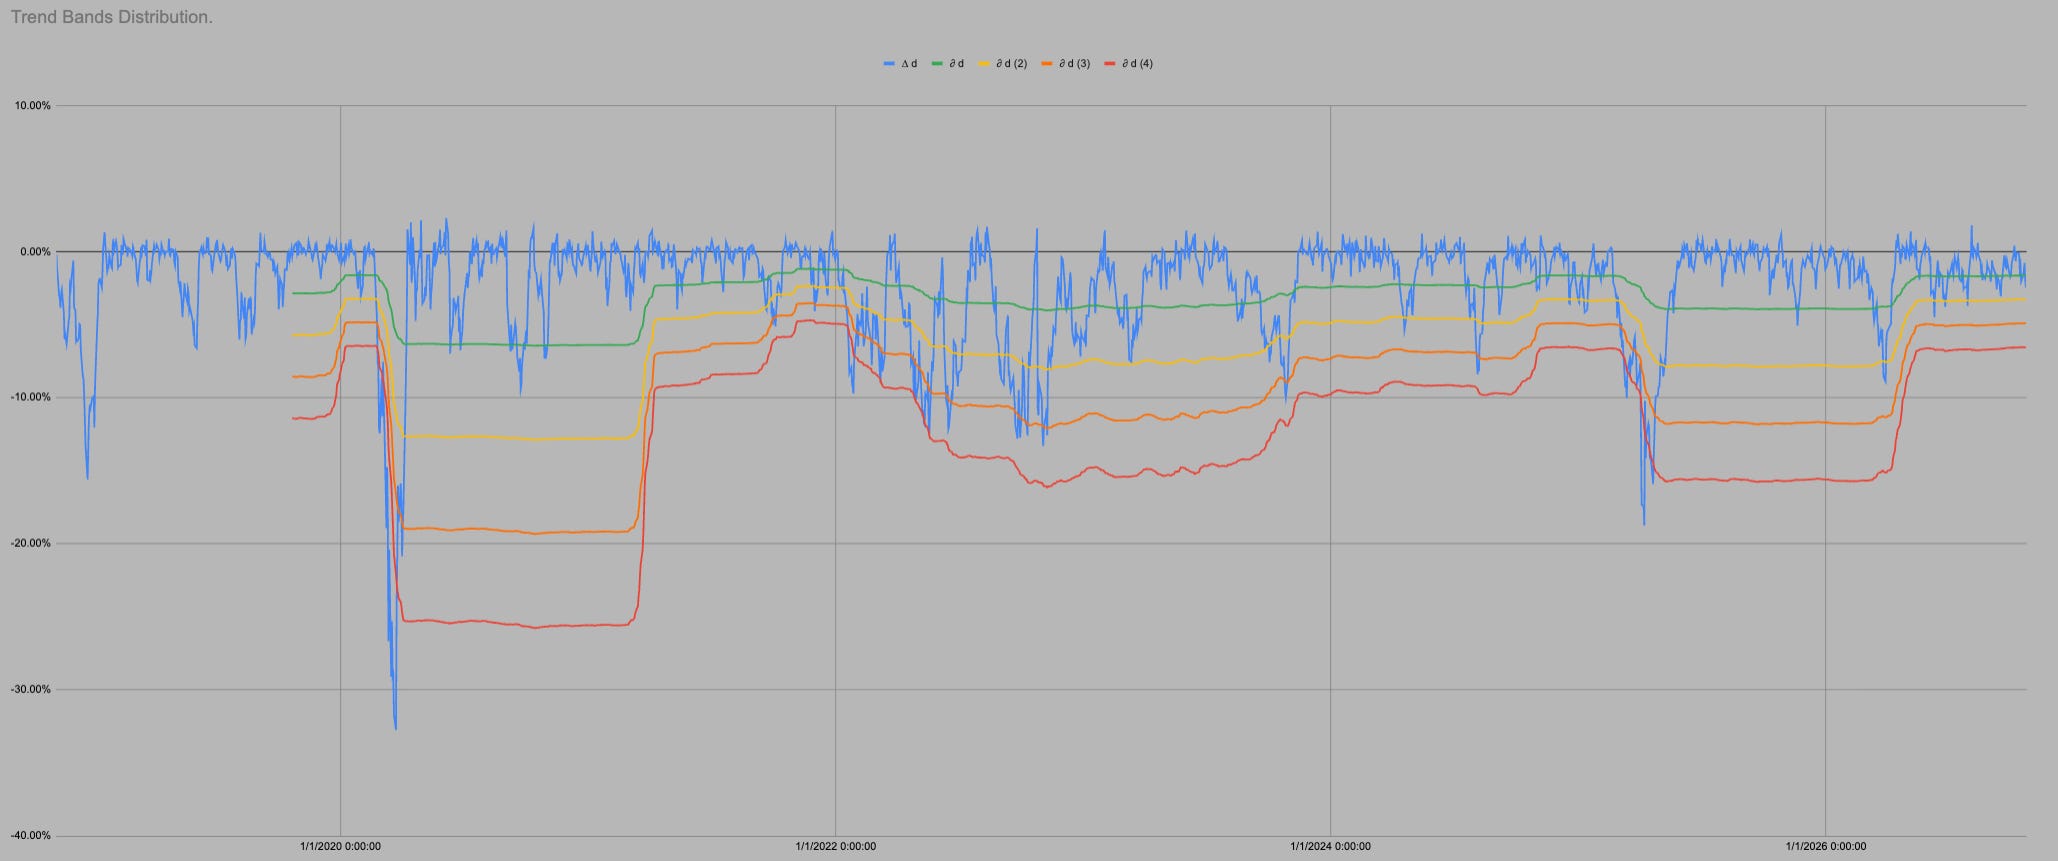
SPY spends 82% of all trading days above this level.
Its all cool beans.

It is all the same chart so I can use all the same data. In the last 1761 trading days SPY has been above “trend” i.e. in green or yellow 81% of days.
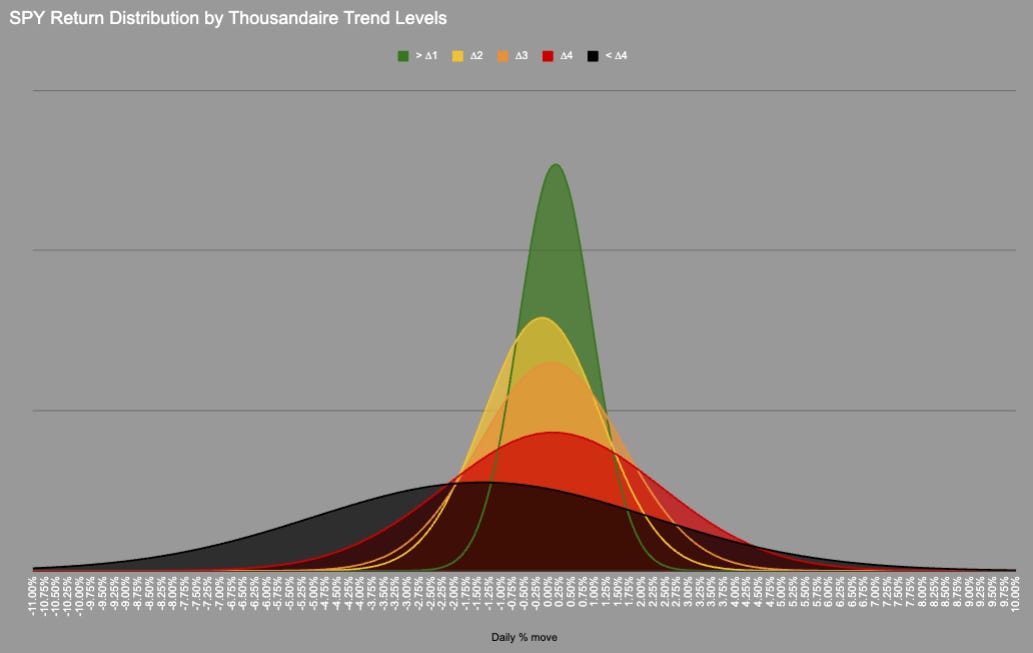
We could probably include orange as the distribution is very similar, but we need a transition point.
In 1761 trading days price has never moved directly from Green into Red/Black there is always an intermezzo hangout in Orange.
KeepItSimpleSubstack

Hot Takes with Hank

Think pieces!


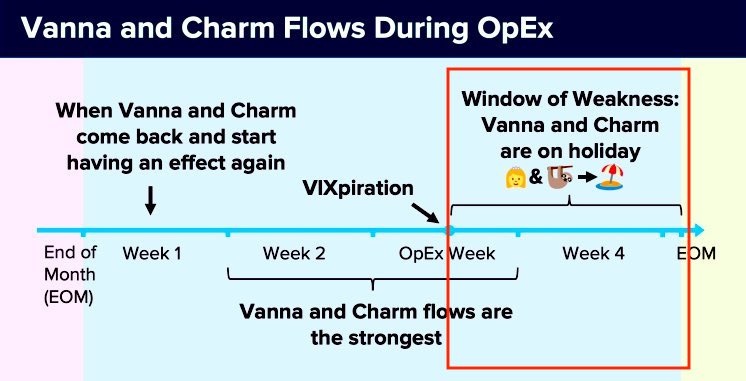
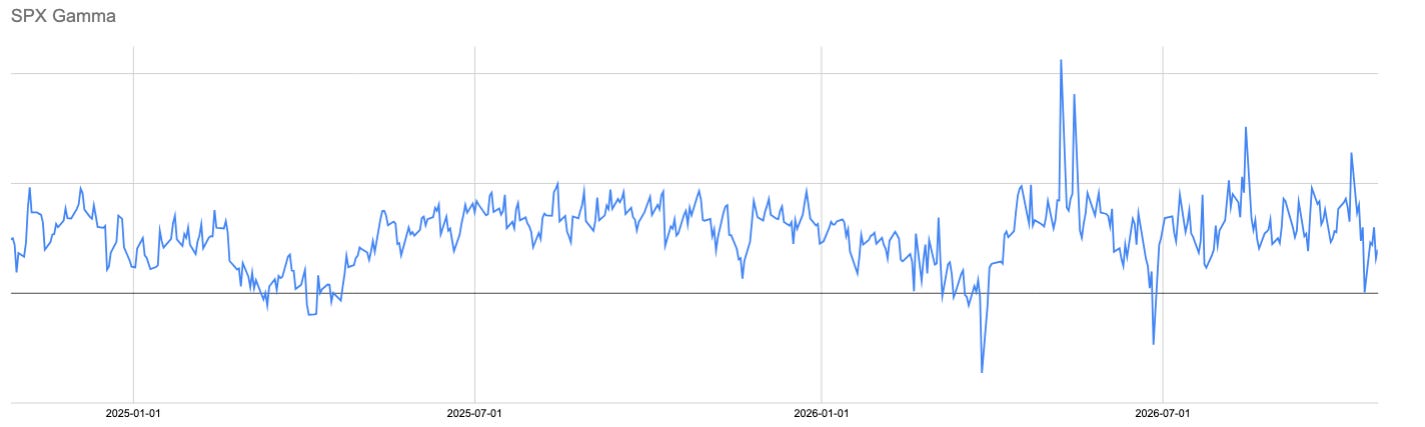
Gamma rebounded from last week.
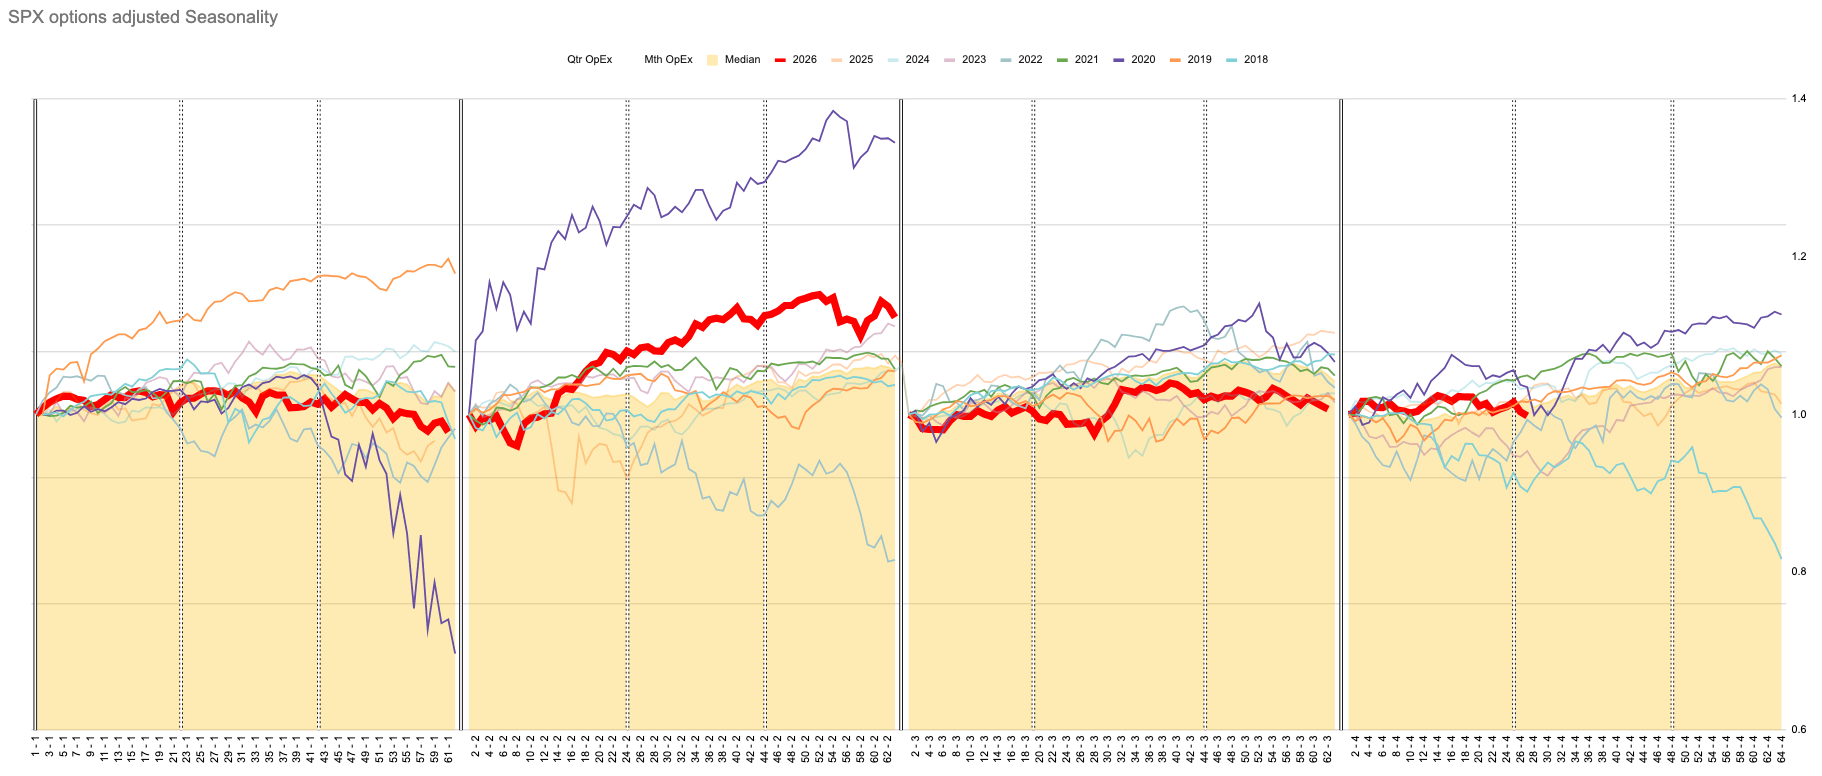
Every year, except 2018, the last 2 months end well. Regardless of first/second year of the cycle the year finishes with a positive move.
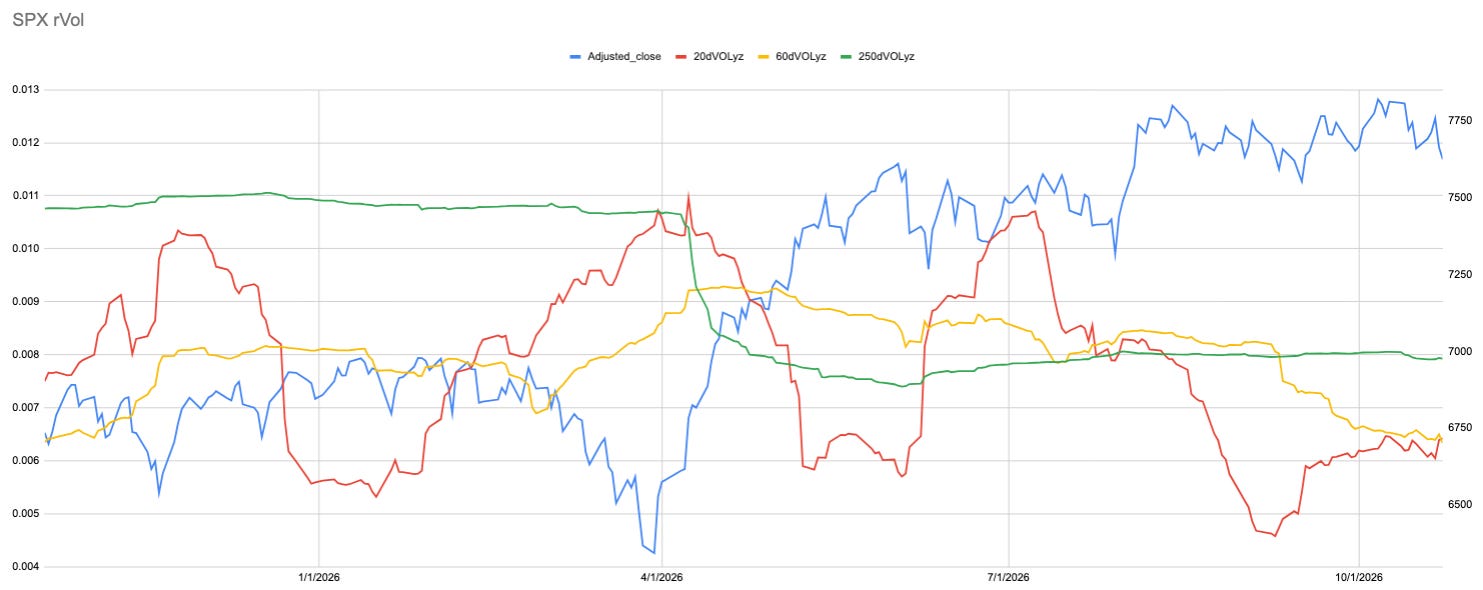
Realised volatility has risen.
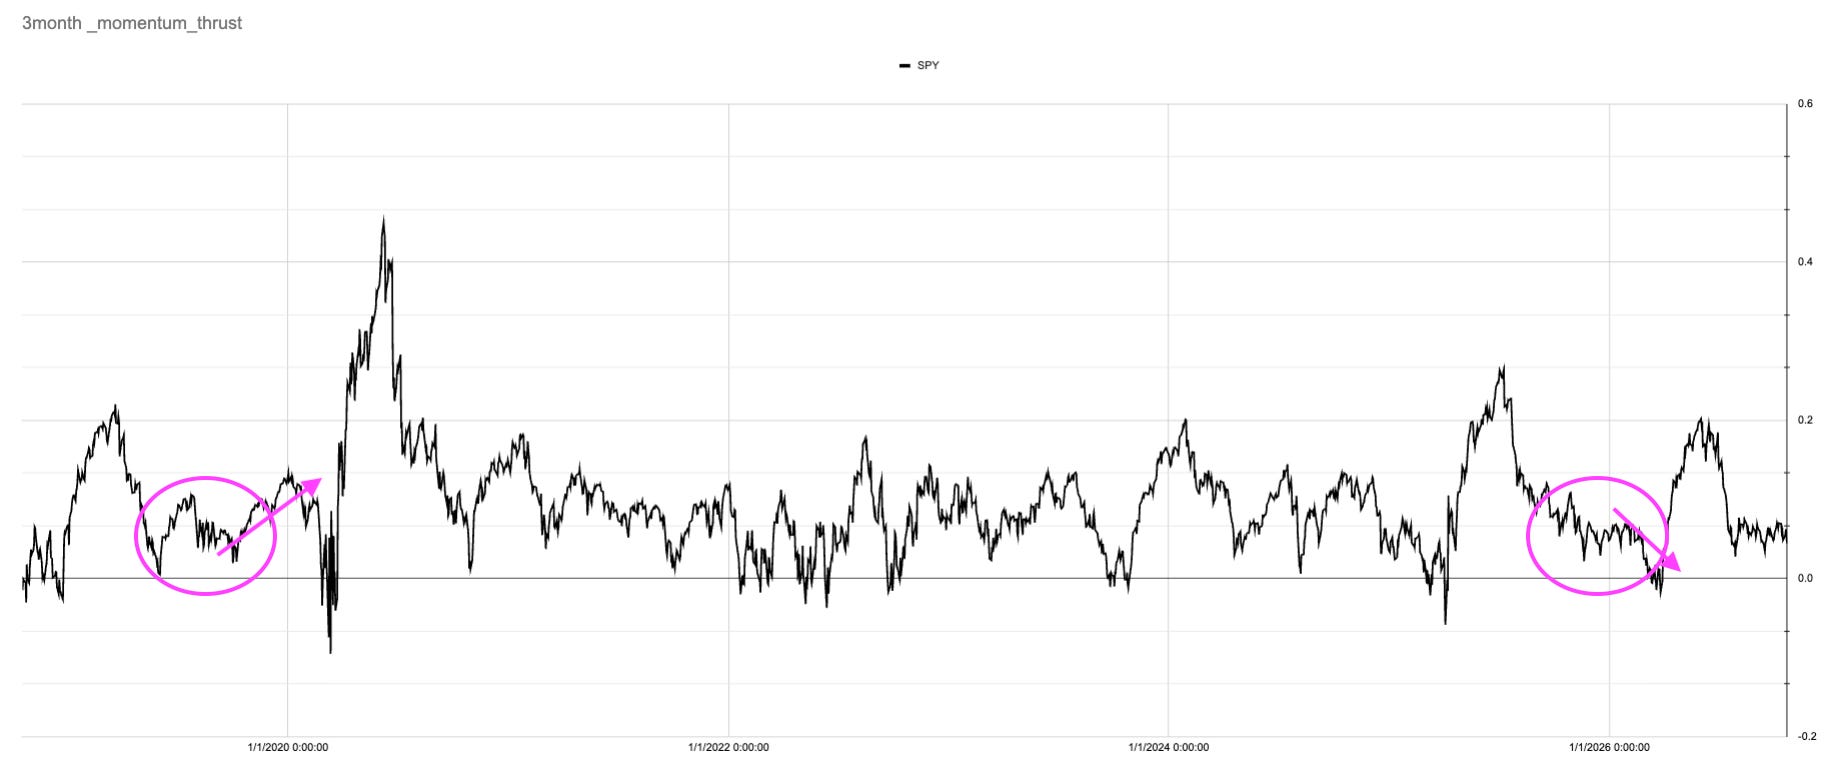
Momentum thrust has been in a static band. Which way could it play out?
I do not currently have the time to play wiggles which is why I am not commenting on them as much.
If you are fast twitch has there been stuff to do? Yes.
If you are slow twitch has there been stuff to do? No.
Before the market can be down 10-15-20-30% it will have to fall another -0.83% and break trend.
I am comfortable with that.