

I advise using the app/website as emails are often truncated due to images!
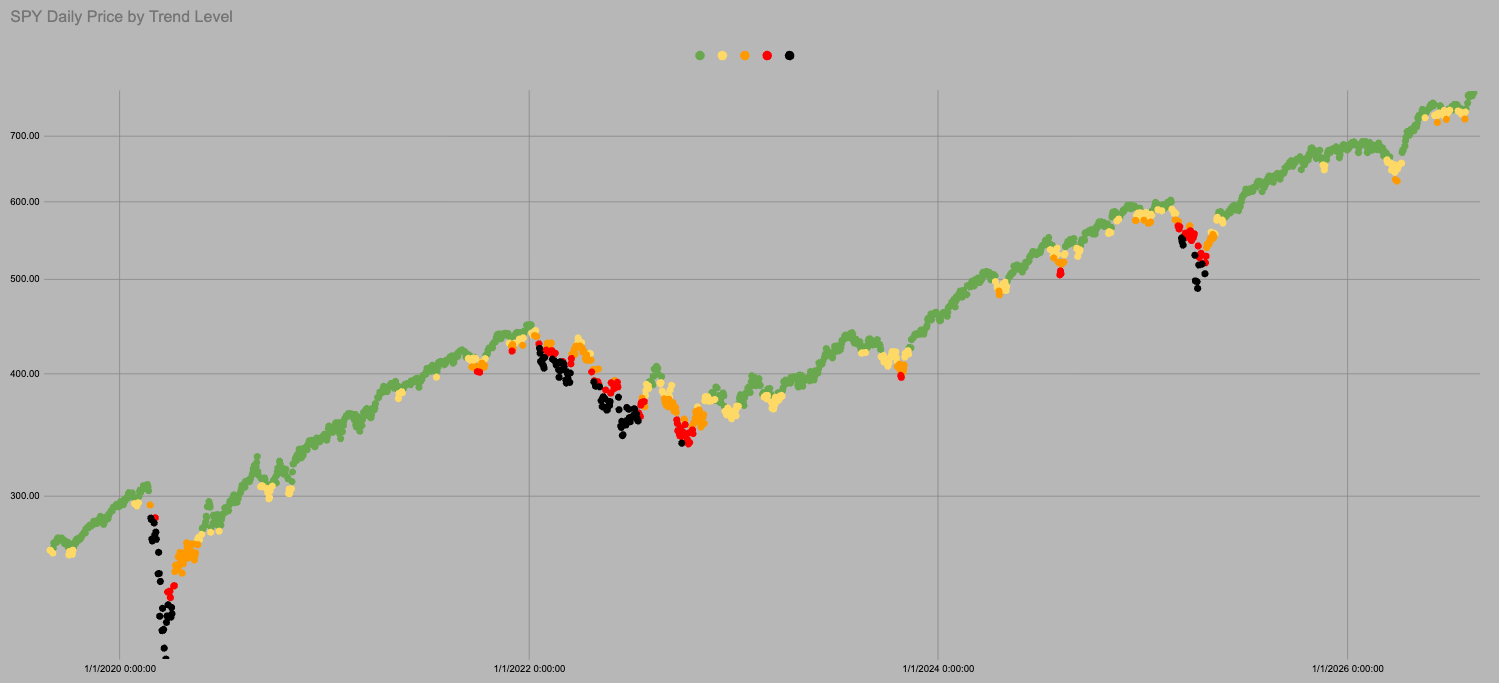
Long run perspective.
If it’s green don’t overthink things!
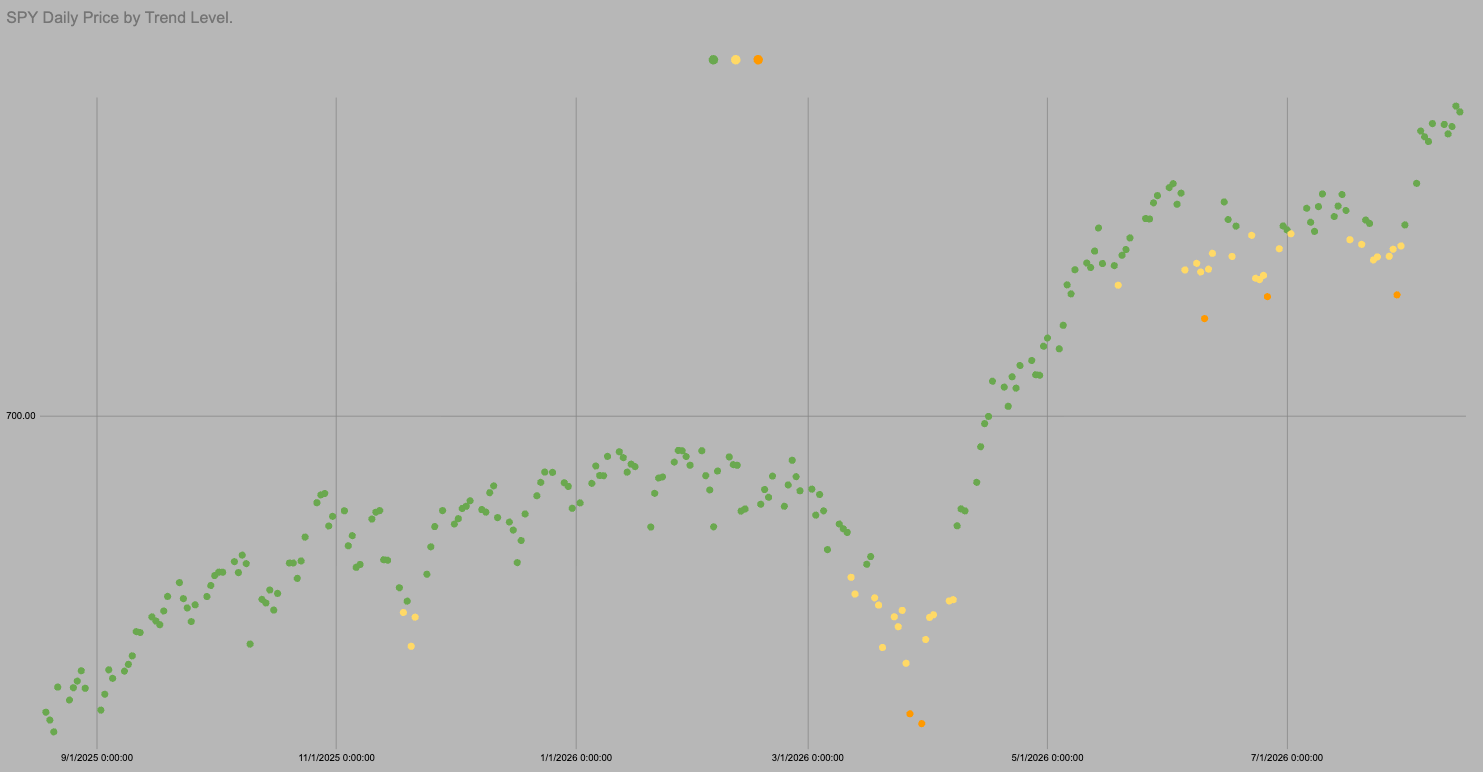
Zoom in our cross over point is orange, that means we’ve broken trend. So there have been some flip flopping over the last few months.
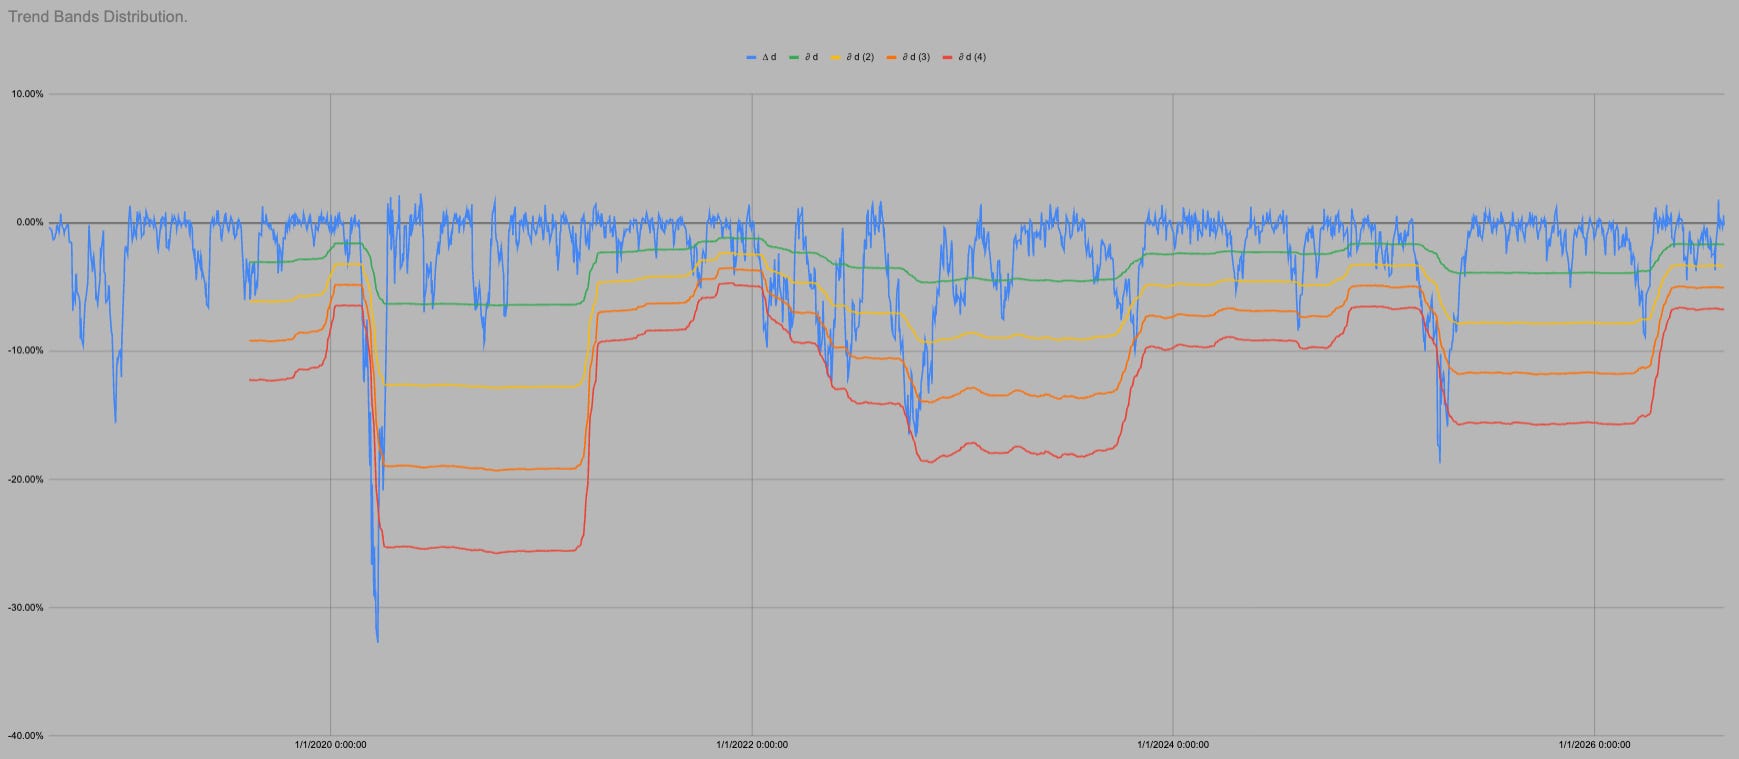
This shows how we calculate the levels that matter for the system to function.
What does it all mean?
The dot is Green
Trend is 751.58
SPY spends 82% of all trading days above this level.
KeepItSimpleSPYman
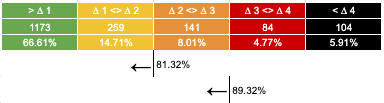
It is all the same chart so I can use all the same data. In the last 1761 trading days SPY has been above “trend” i.e. in green or yellow 82% of days.
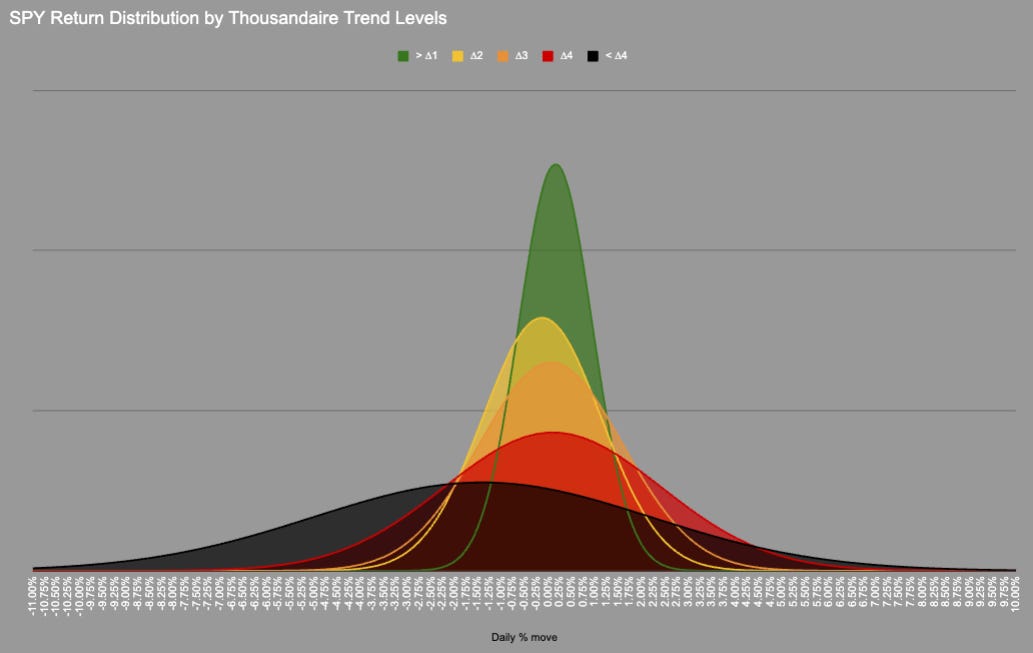
We could probably include orange as the distribution is very similar, but we need a transition point.
In 1761 trading days price has never moved directly from Green into Red/Black there is always an intermezzo hangout in Orange.
KeepItSimpleSubstack

Hot Takes with Hank
Think pieces!


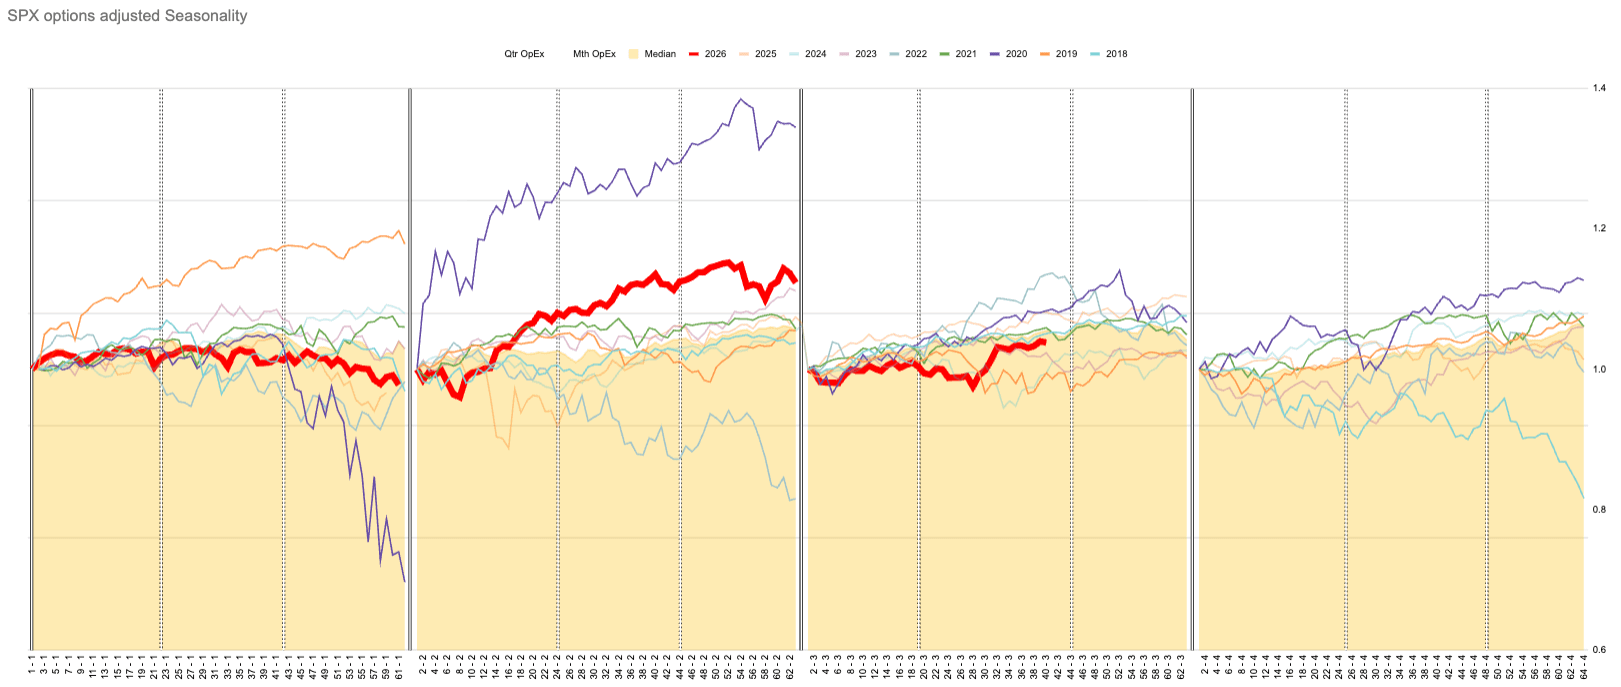
Third quarter has the smallest amount of variation…
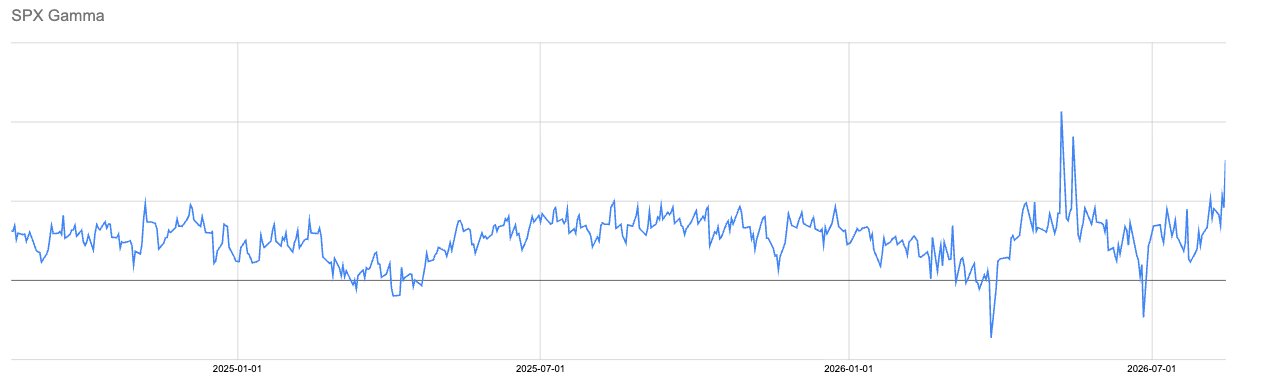
Gamma is positive.
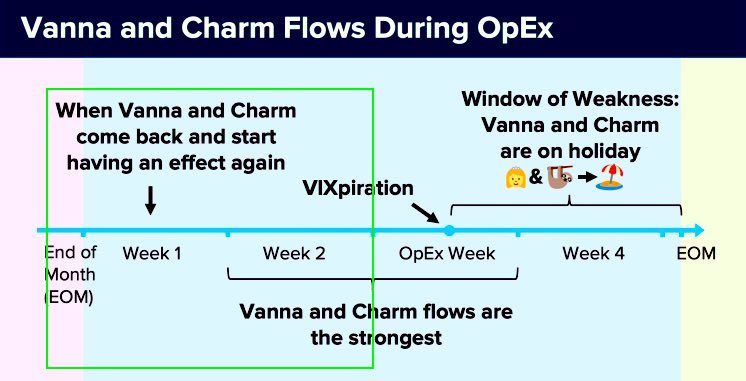
Will VIXperation mark a turning point?
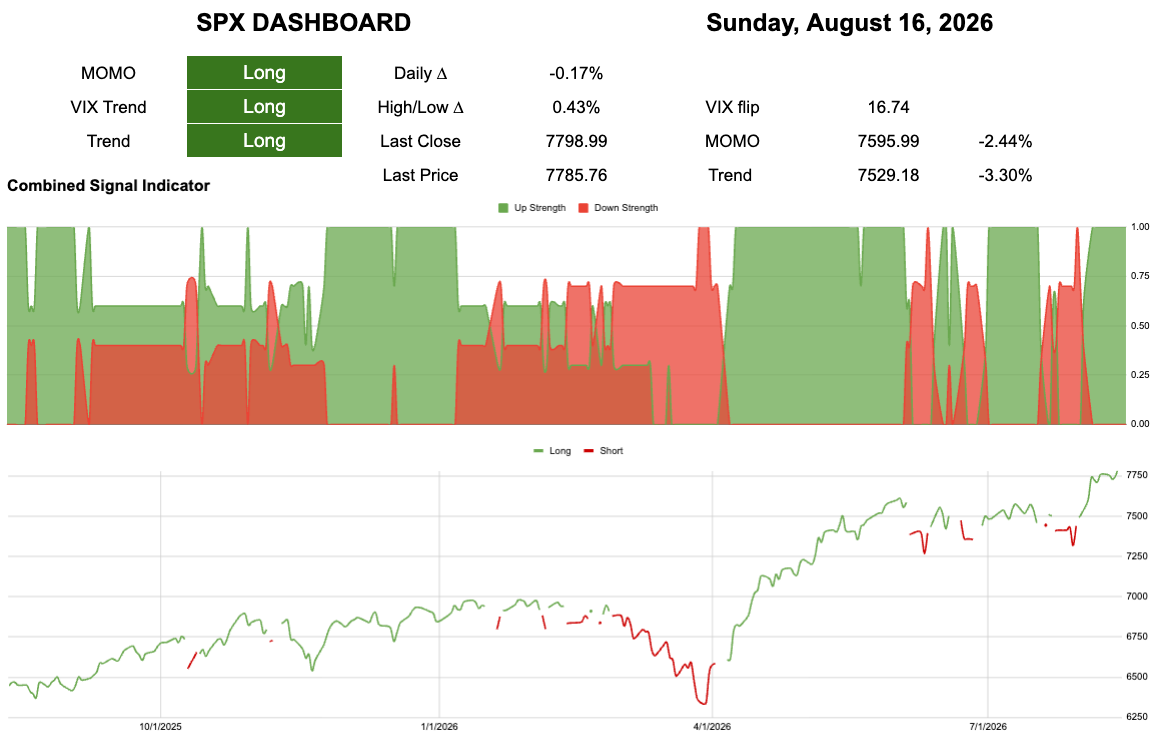
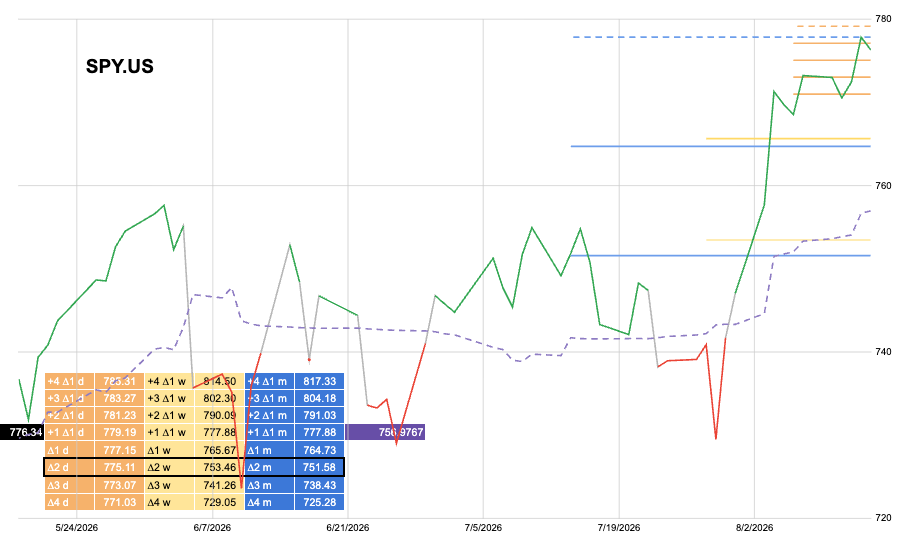
If you like all the wiggly wiggles then here are the levels.

The wiggles are fine.
For a simpler life If we just hold above trend and go flat below trend we can achieve this with the past.
How likely is it to manifest into the future?
Who knows?
I certainly don’t. It sure does help my sanity though to have a couple of numbers to watch out for instead of trying to pick my way through the split personality of “the noos”.