

I advise using the app/website as emails are often truncated due to images!
TL;DR
The dot is Yellow
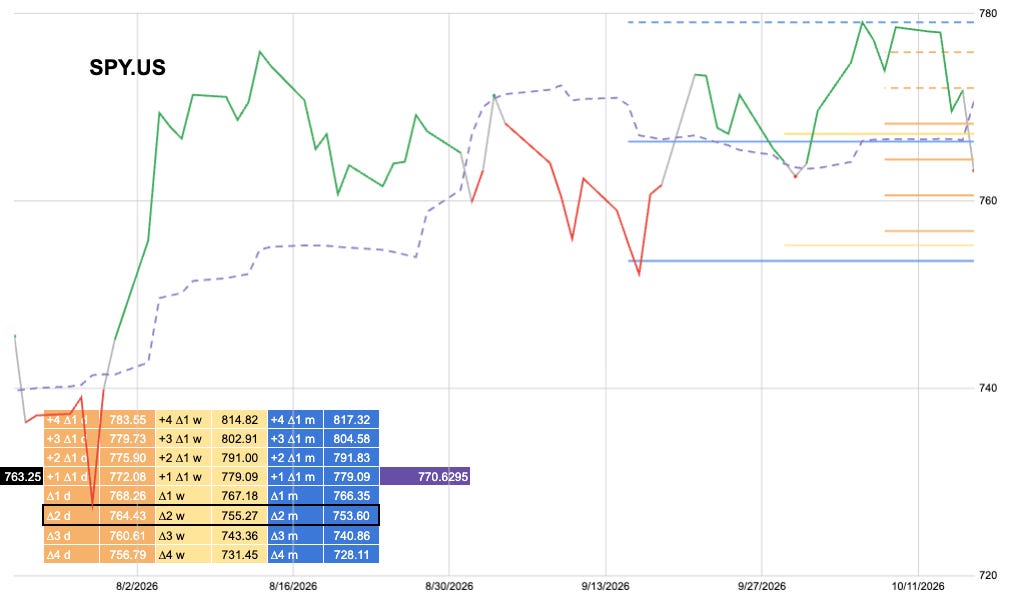
Trend is 753.60
Pick your poison. Fast or Slow? Once you know how you want to play it will help you make decisions.
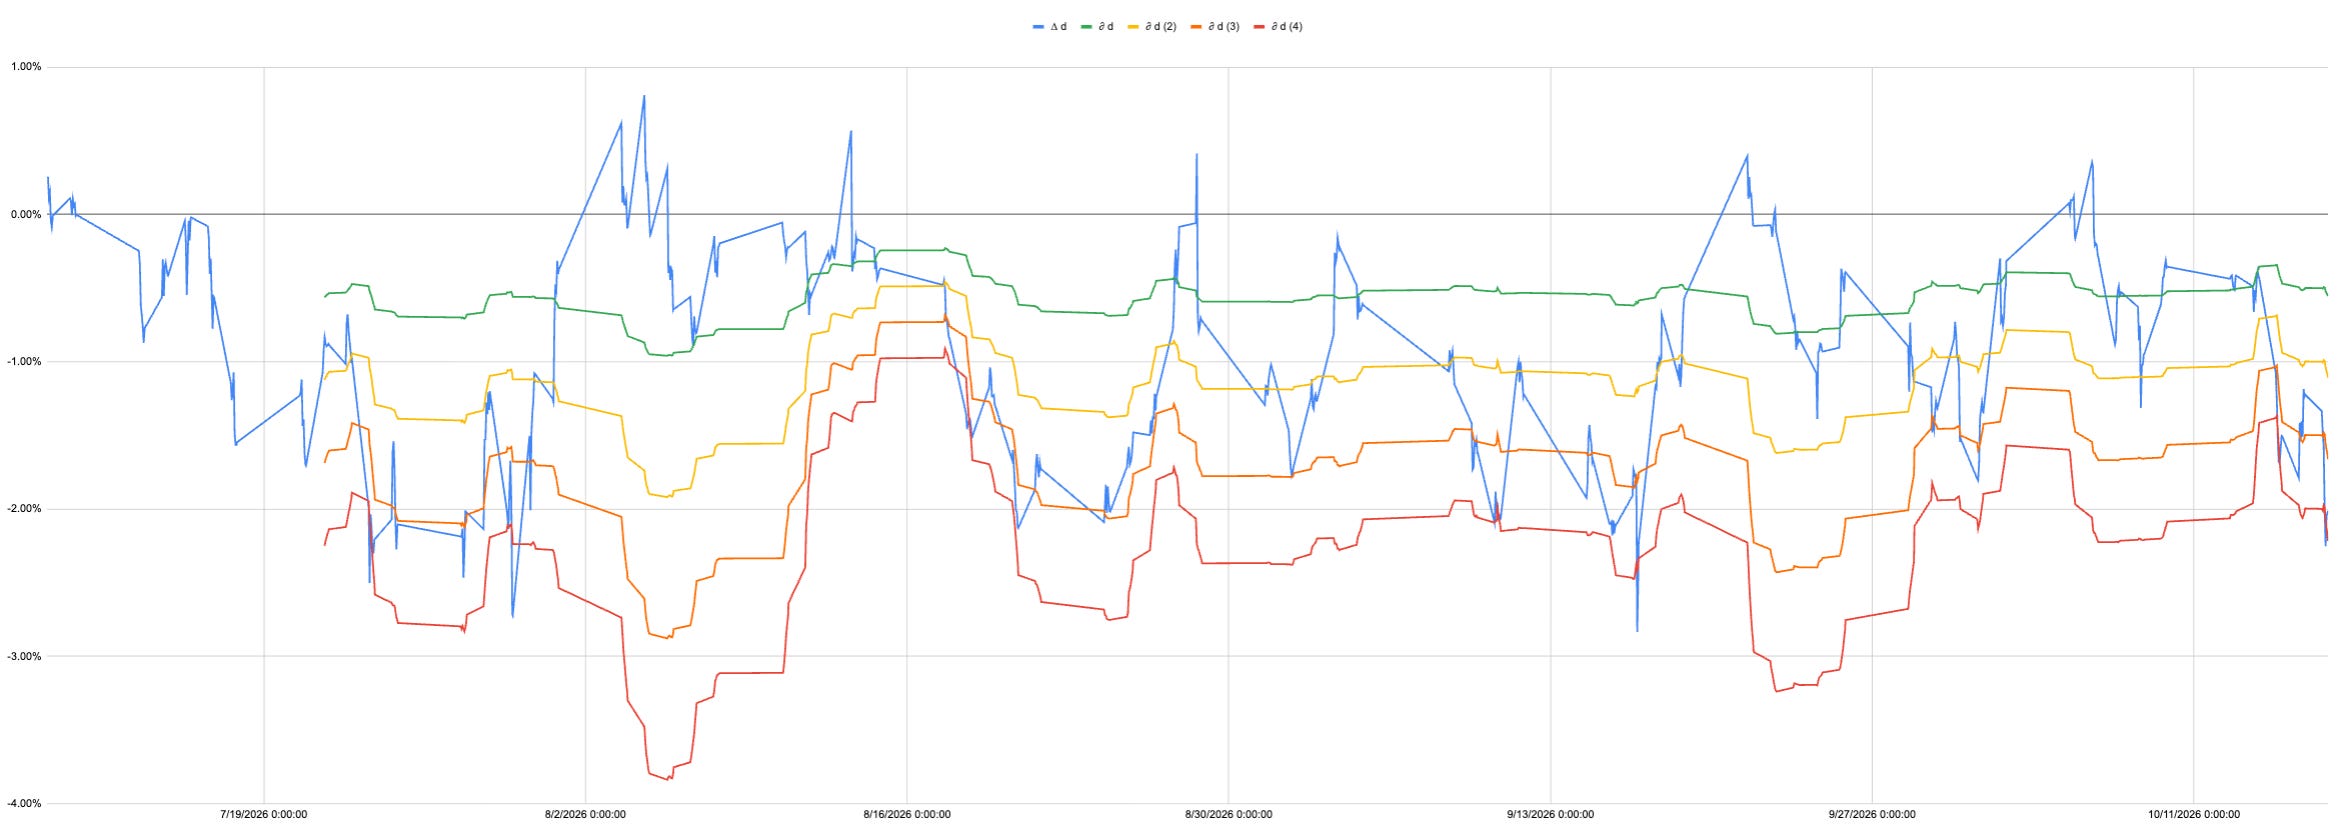
This is a messy chart using the hourly data.
What’s just happened in the last few days is exactly what normally happens.
The end of the cycle is hectic! Why?
All the pressure and movement has been squeezed into a smaller and smaller space.
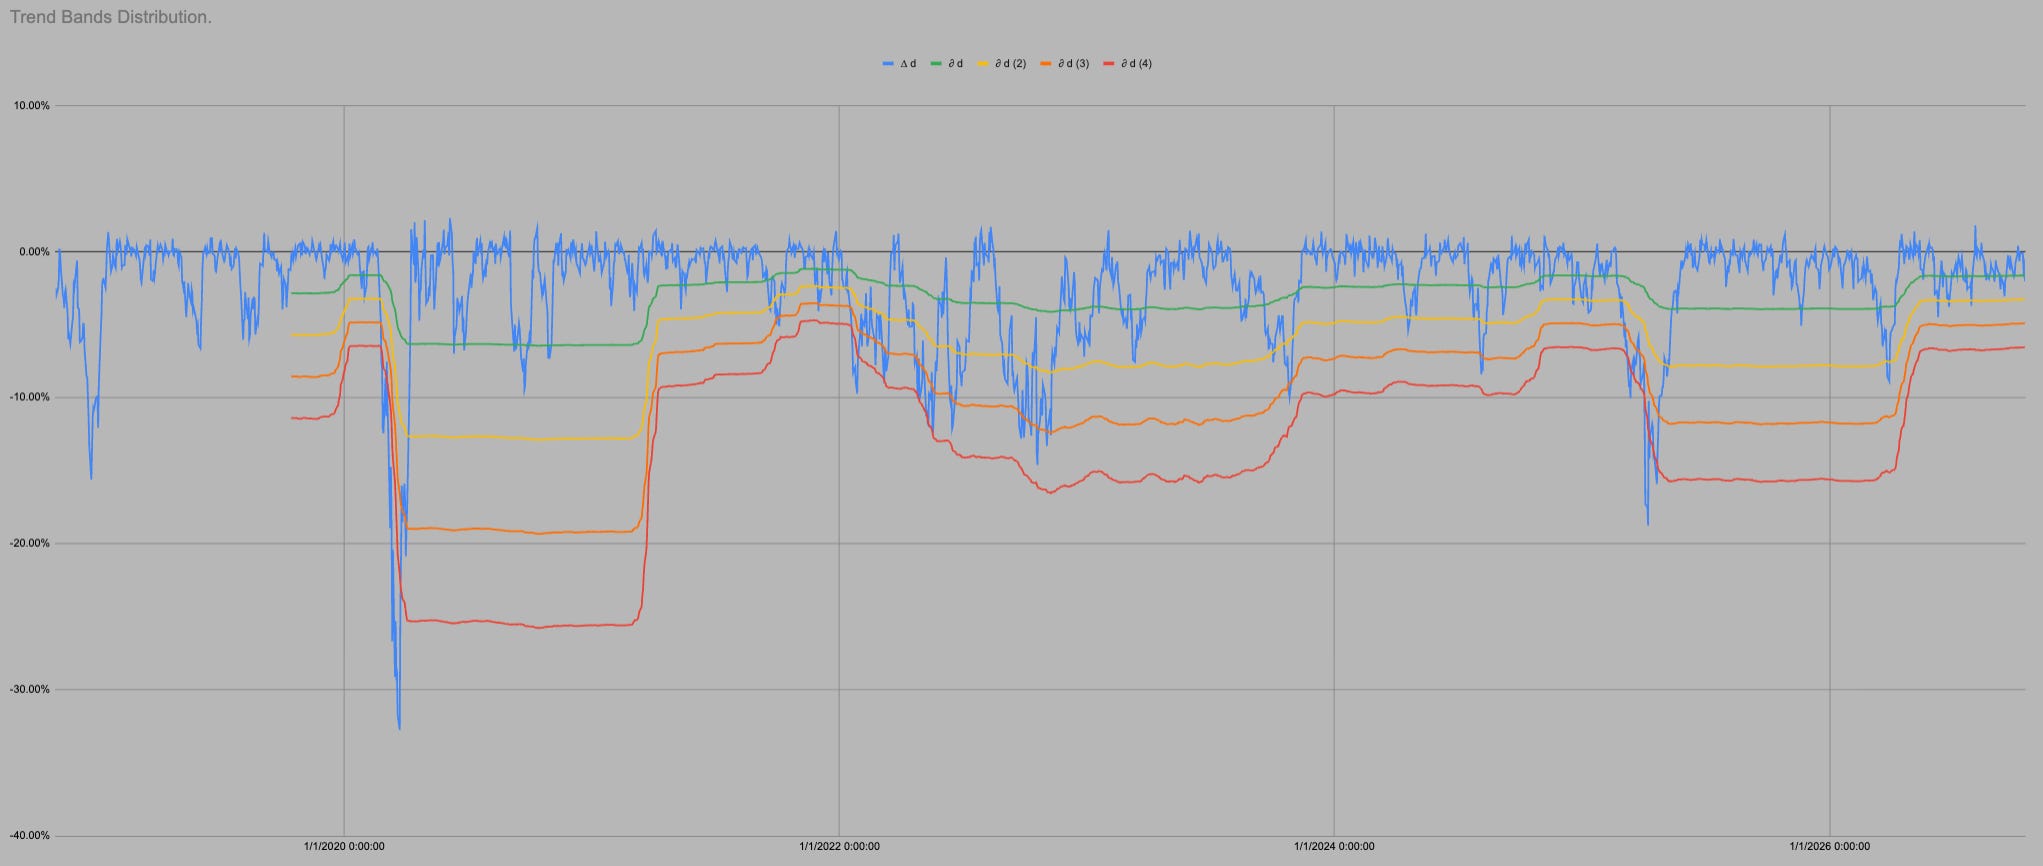
The relief after a long rally with a test of trend used to be a -10% move. Then everyone could kinda say “oh that makes sense because {insert macro noise here} happened” then we move through it and the market can move up again.
Now we have no reprieve. -2% from all time highs triggers a “black line of doom” a pressure point that normally be 5-6% further down.
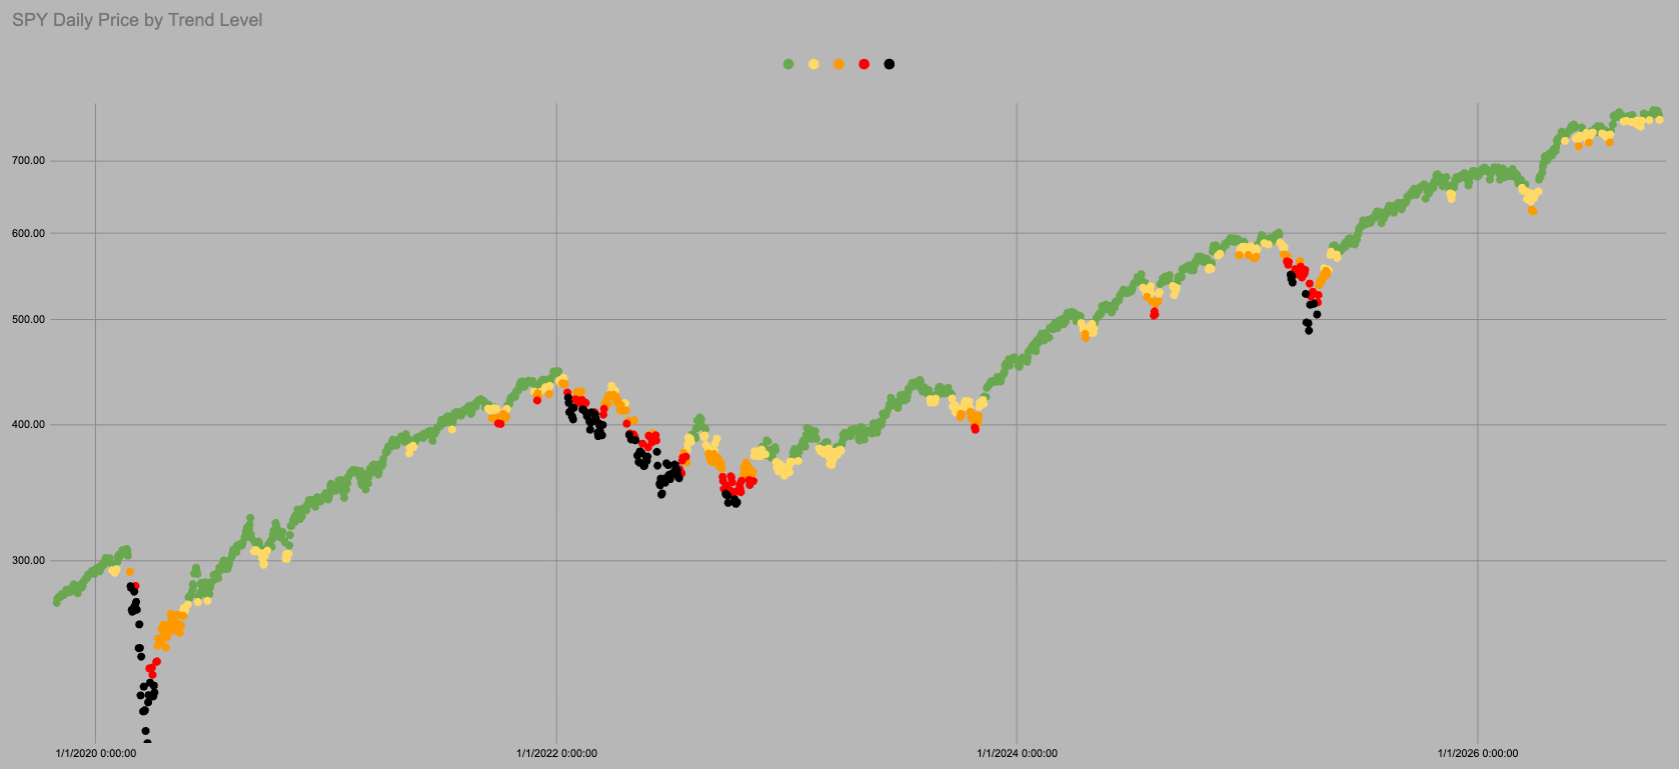
This isn’t me telling you to go max long on Monday. The ideal position would be that you have been long since the last orange dot, and all the orange dots since April 2025.
Now you don’t have to over think it.
It is what it is and we wait for it to break trend.
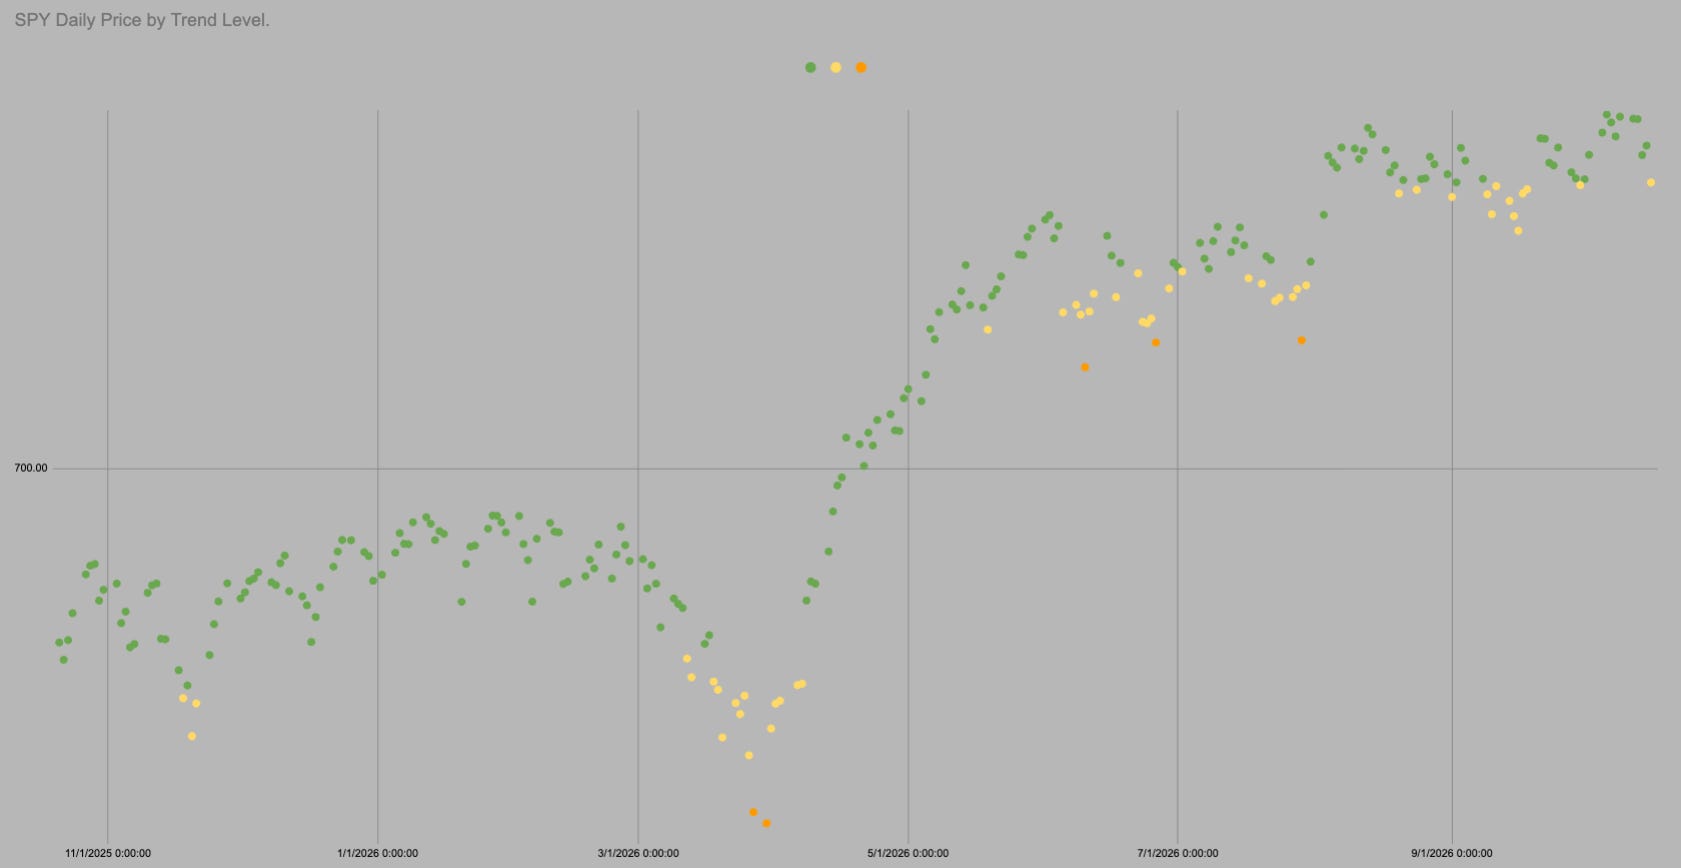
The dot is Yellow
Trend is 753.60
SPY spends 82% of all trading days above this level.
Its all cool beans.

It is all the same chart so I can use all the same data. In the last 1761 trading days SPY has been above “trend” i.e. in green or yellow 82% of days.
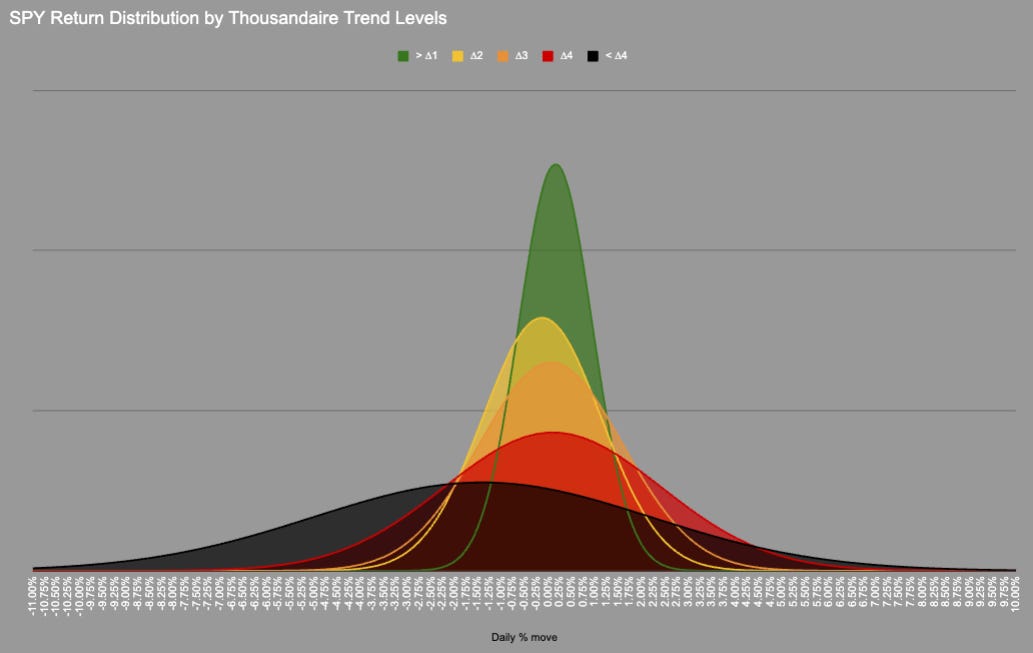
We could probably include orange as the distribution is very similar, but we need a transition point.
In 1761 trading days price has never moved directly from Green into Red/Black there is always an intermezzo hangout in Orange.
KeepItSimpleSubstack

Hot Takes with Hank

Think pieces!


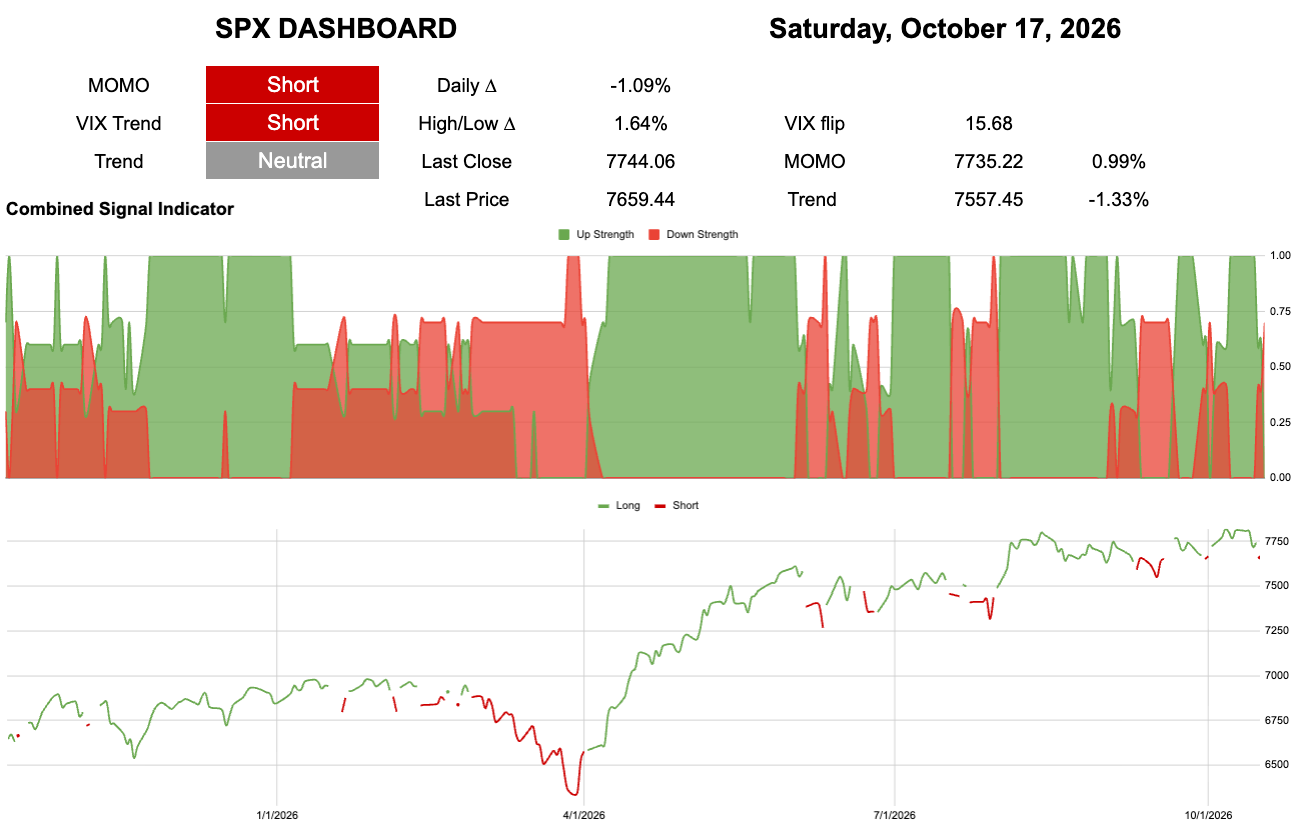
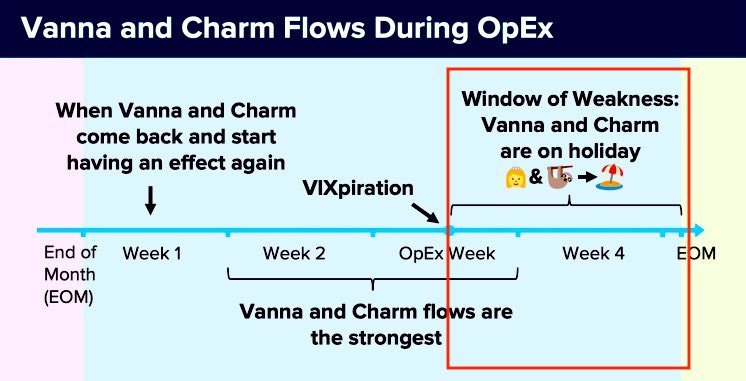
We had a flip this week Equity OpEx came on Friday then we have VIXpiry next Wednesday.
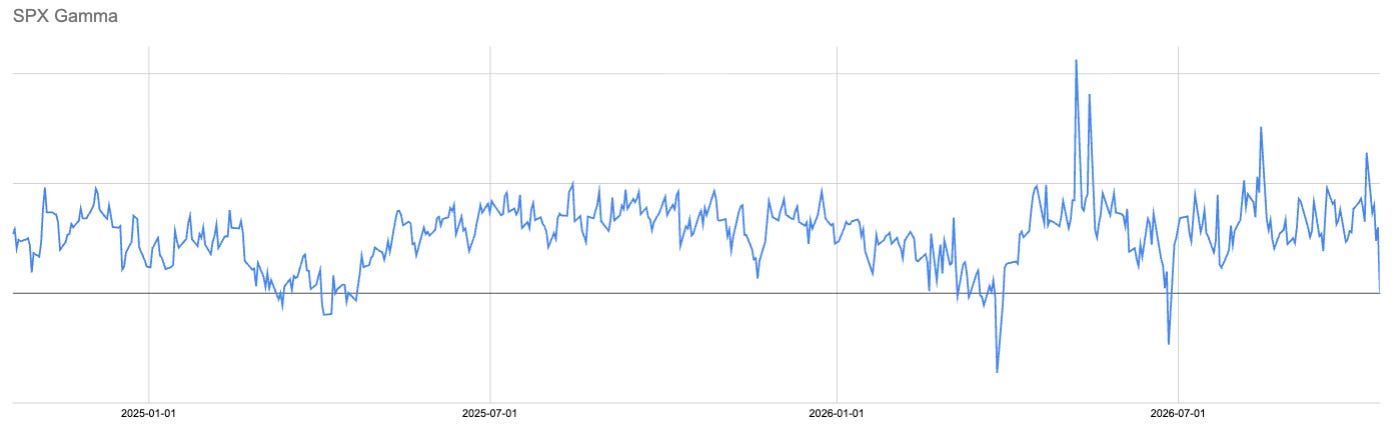
Gamma made a big move to negative.
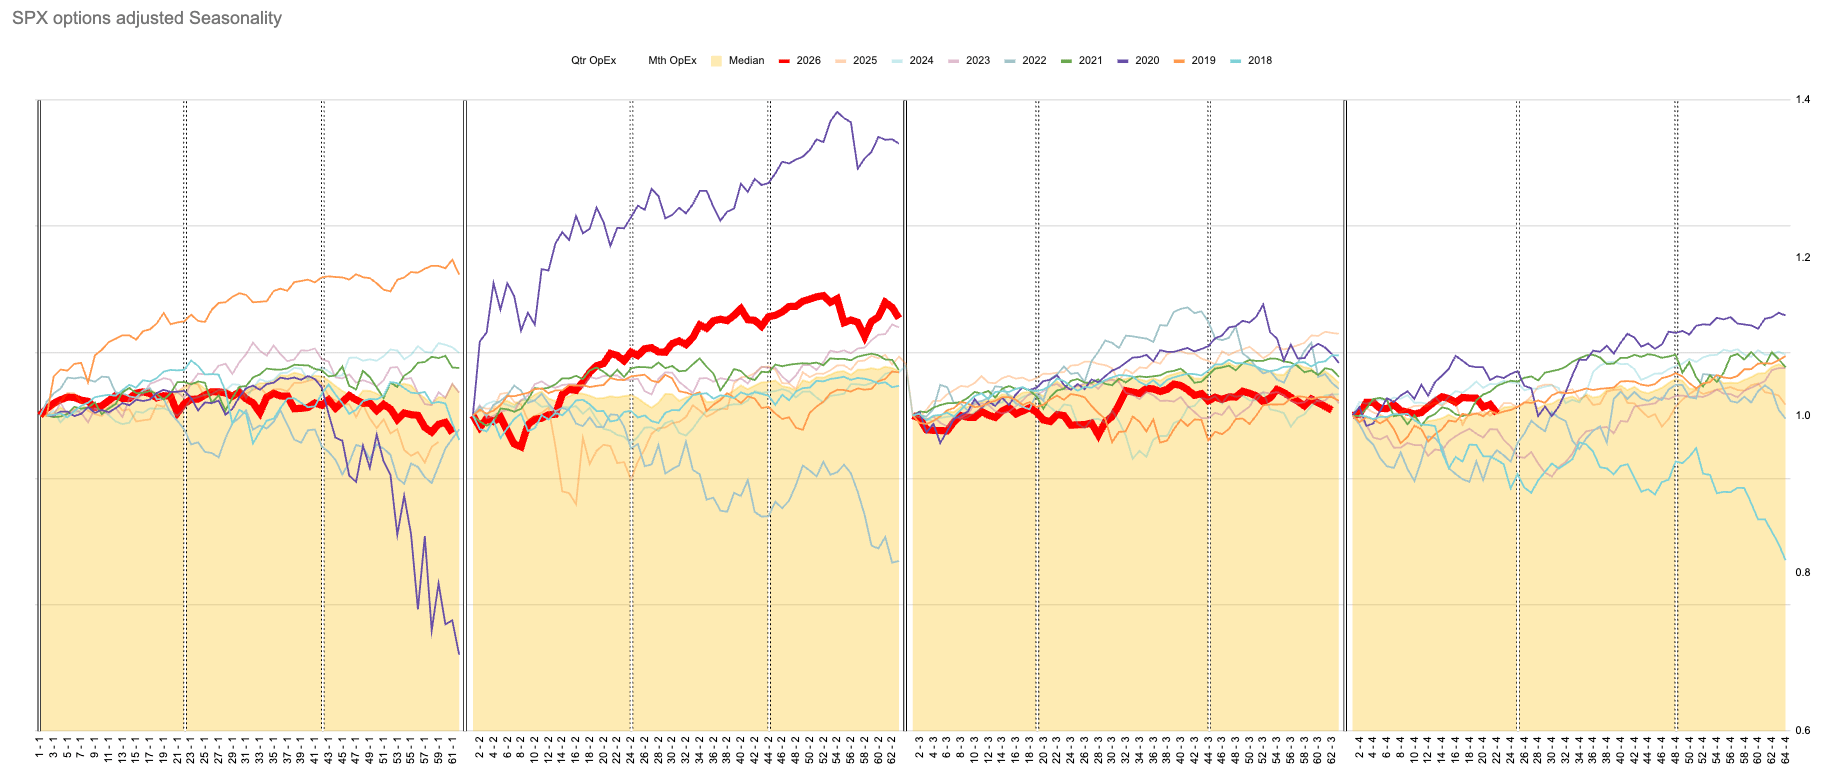
OpEx cycle is doing its thing.
Have a lovely weekend everyone.