

I advise using the app/website as emails are often truncated due to images!
TL;DR
The dot is Red
Trend is 753.12
From last week has anything changed?
“you said that last week Chris and look where we are now!”
Yeah that stung a bit. I couldn’t have been more wrong about a rotation back into semi-conductors.
We have to roll with the punches, I don’t get to take victory laps and talk about how easy it is to just follow a system. If I don’t also take the shoe in when the same backtests and expected returns produce the same painful outcomes.
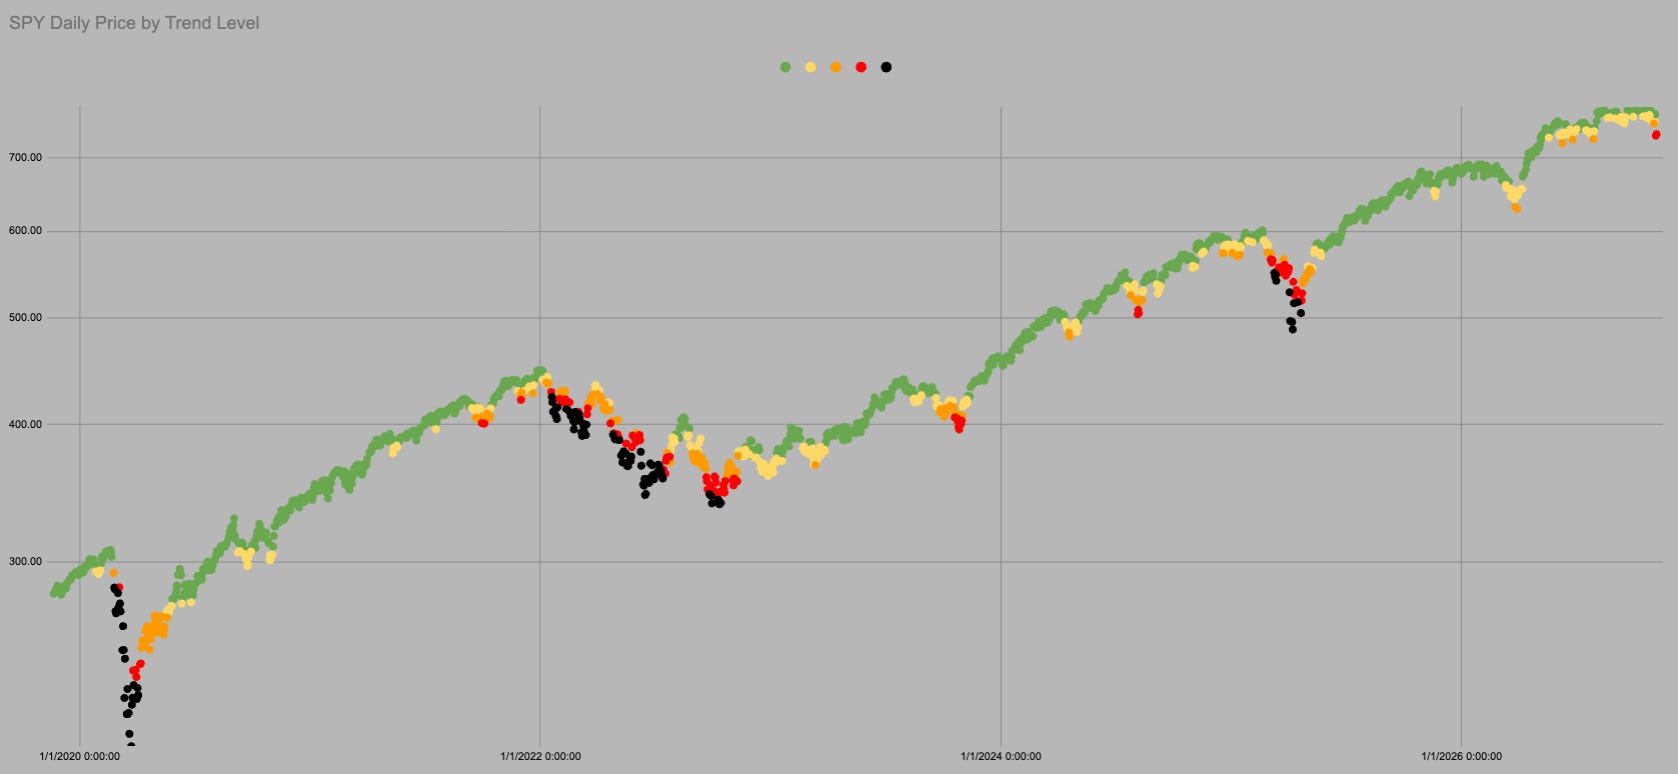
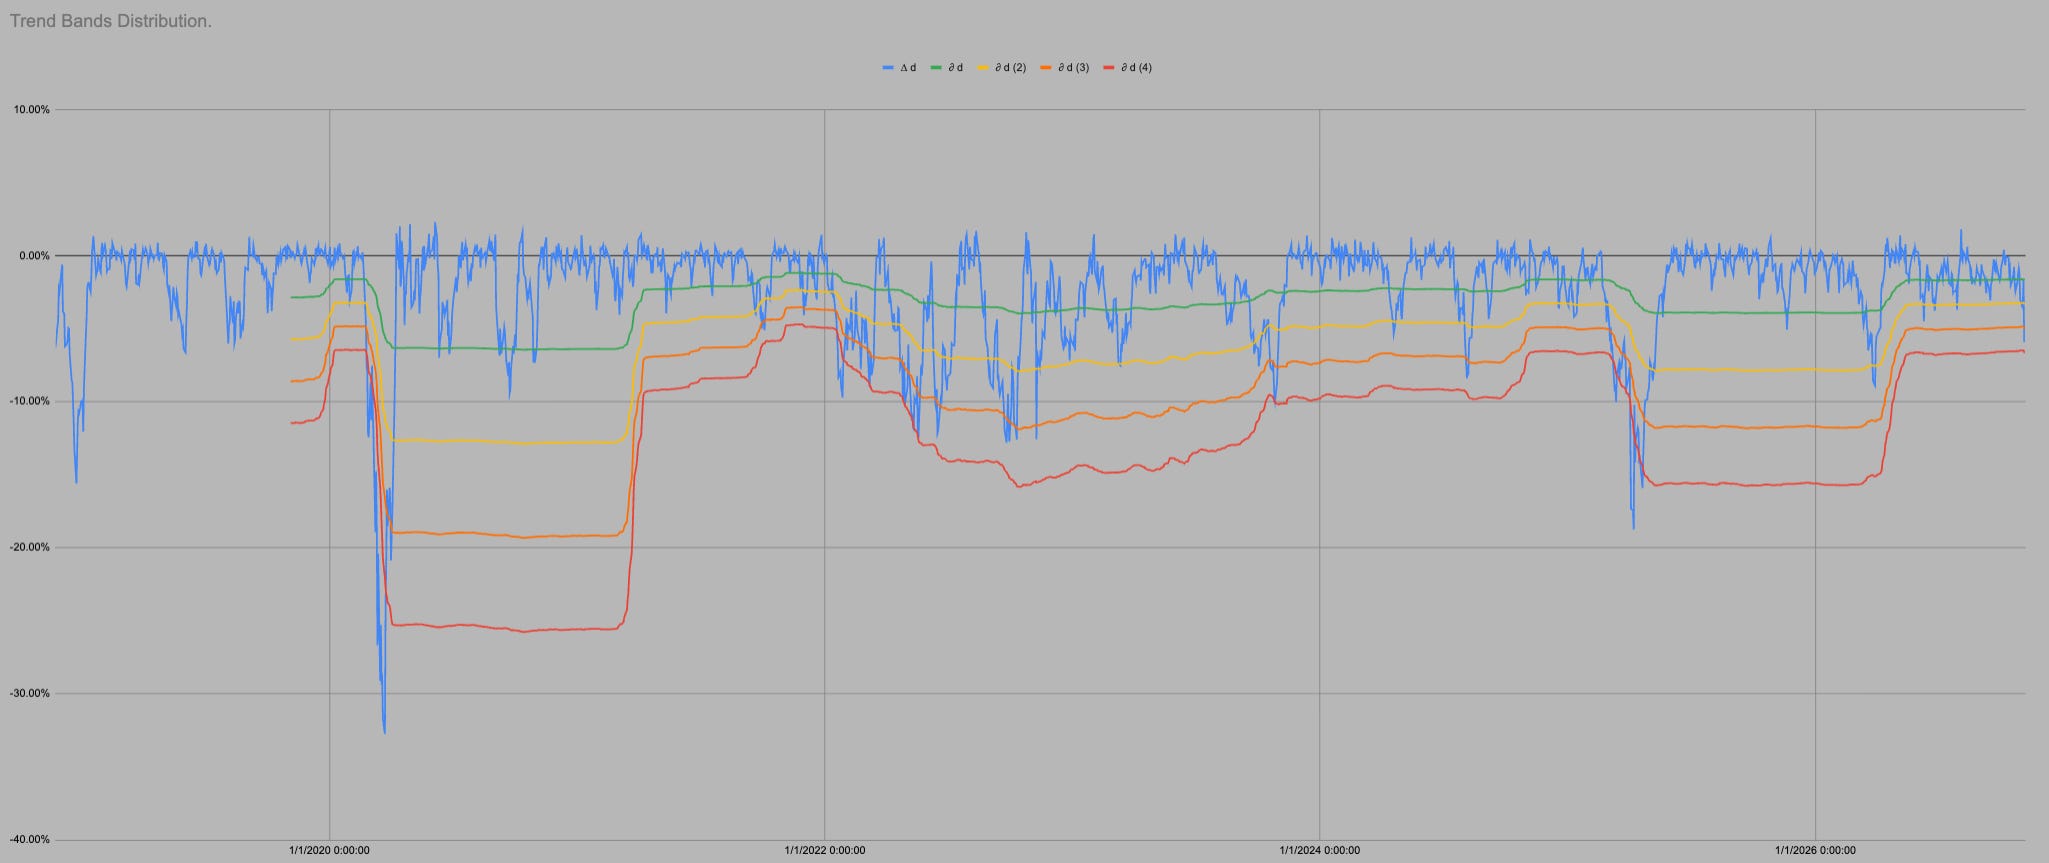
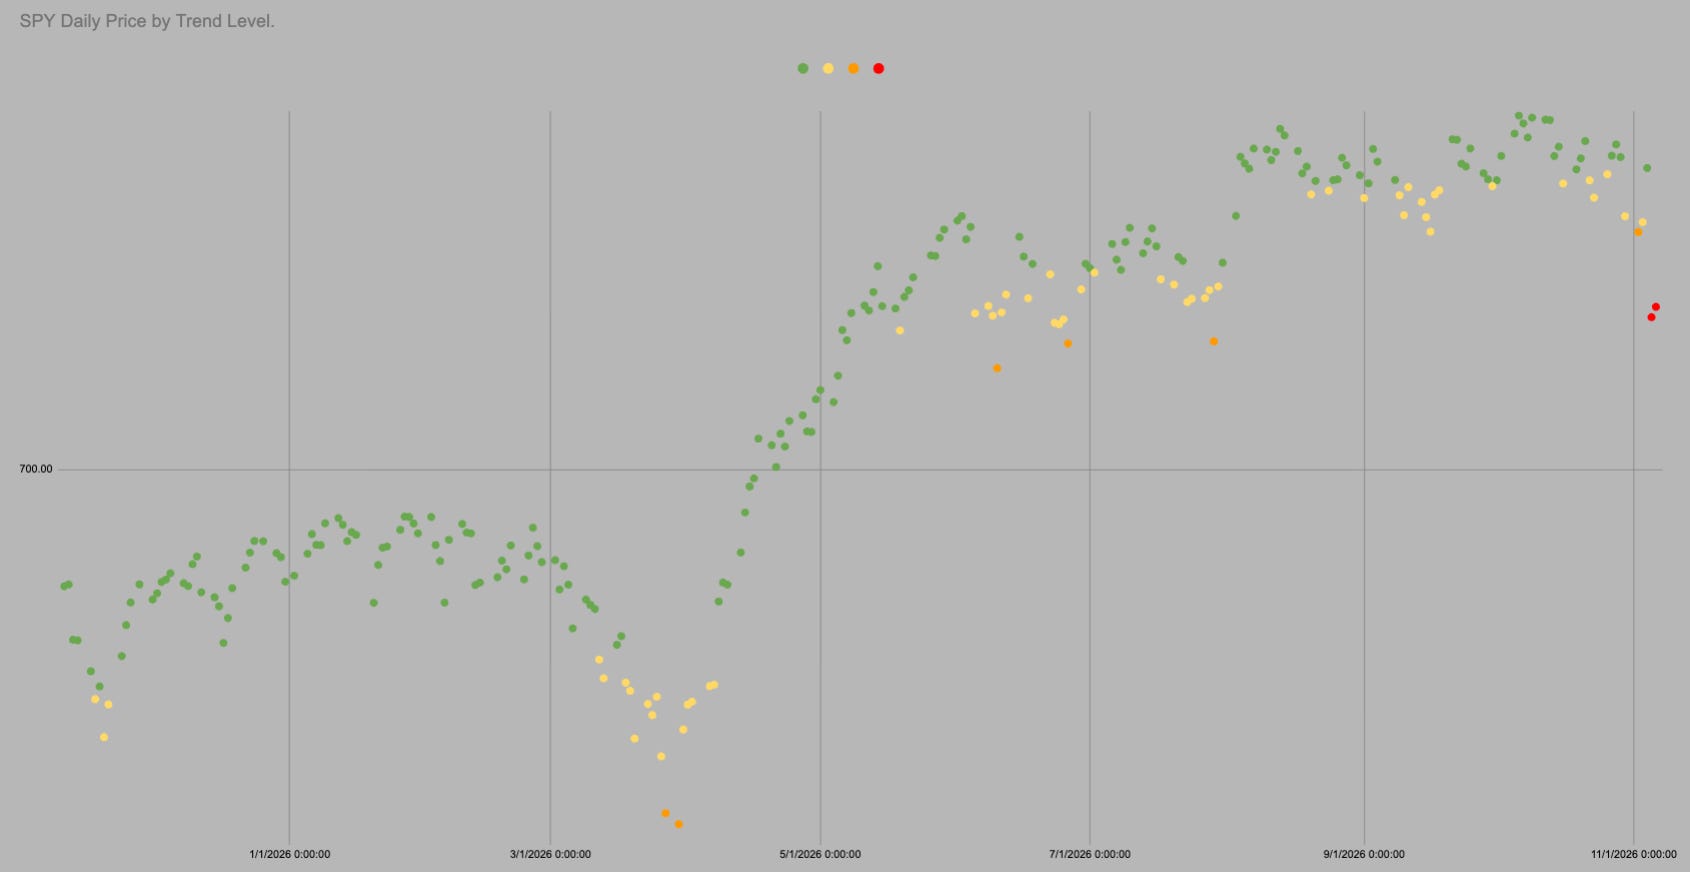
The dot is Red
Trend is 753.12
SPY spends 93% of all trading days above this level.

It is all the same chart so I can use all the same data. In the last 1761 trading days SPY has been above “trend” i.e. in green or yellow 81% of days.
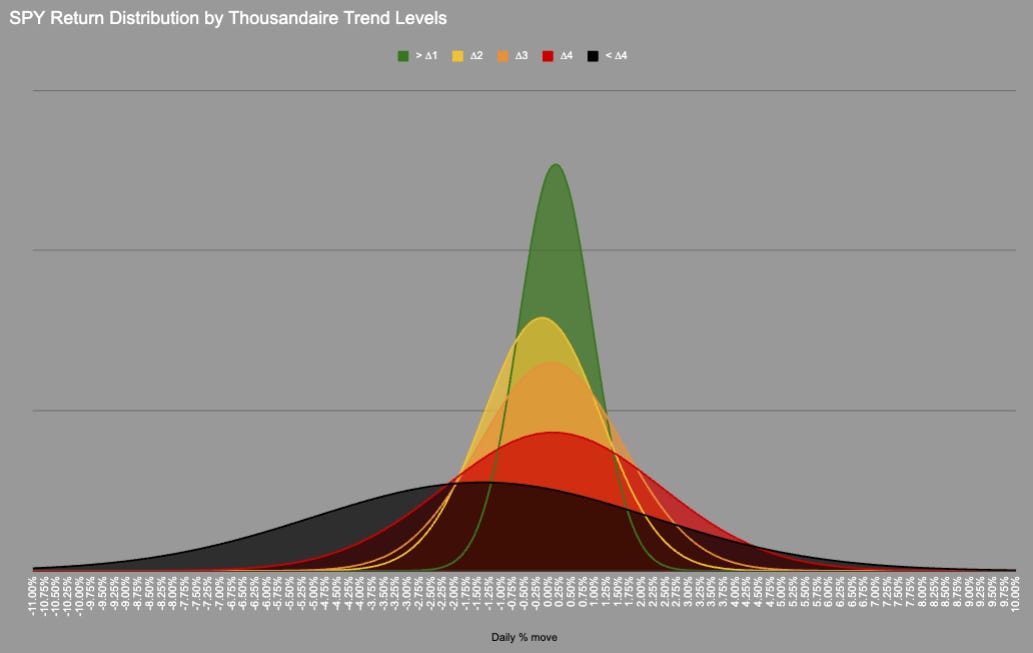
We could probably include orange as the distribution is very similar, but we need a transition point.
In 1761 trading days price has never moved directly from Green into Red/Black there is always an intermezzo hangout in Orange.
KeepItSimpleSubstack

Hot Takes with Hank

Think pieces!


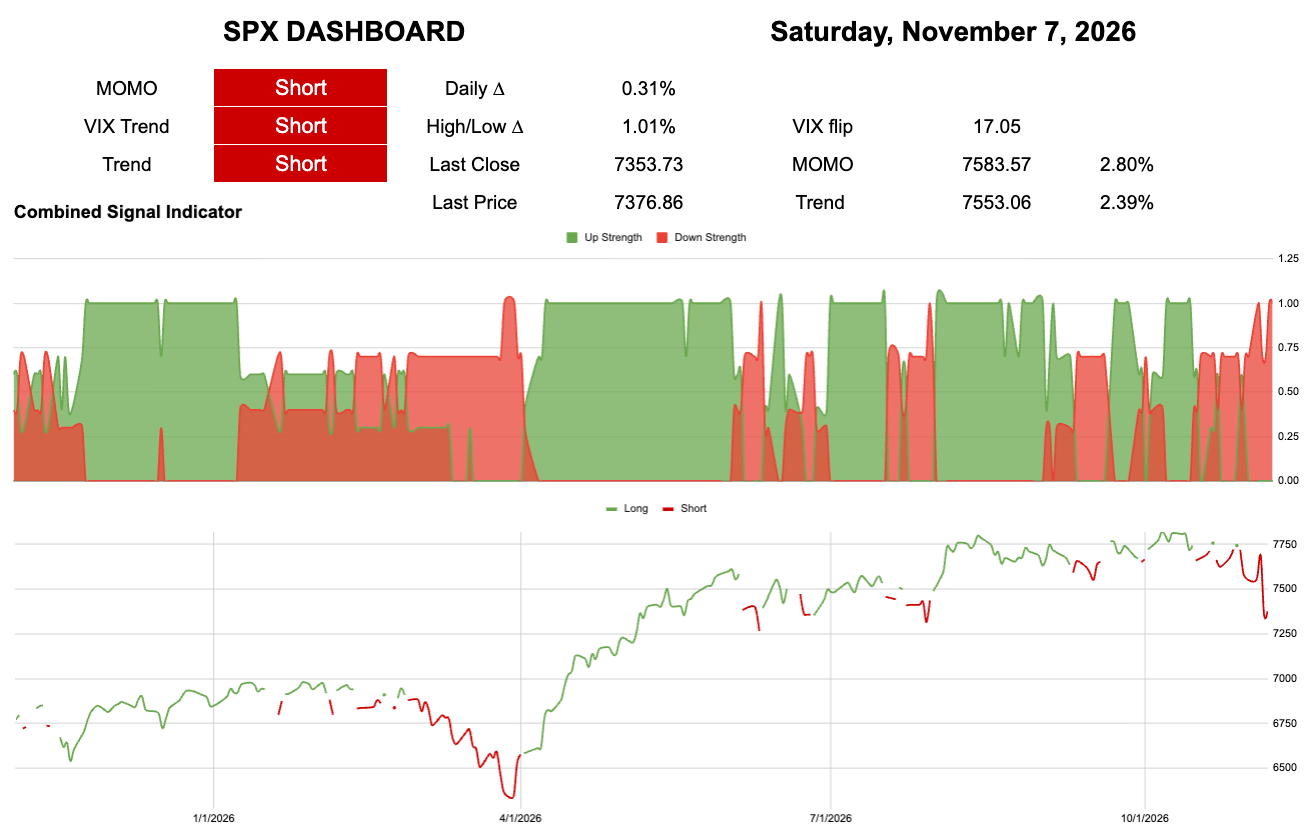
Calamity was around the corner! Nothing like a swift kick in the nuts to remind you you're not as clever as you think!
At the risk of sounding like a broken record…
Has anything changed?
Remember in August 2024 ( I will wait while you google it..) when Some nonsense came out over the weekend about Japan blah blah rates blah blah end of the bond market. How many times has the bond market ended by the away?
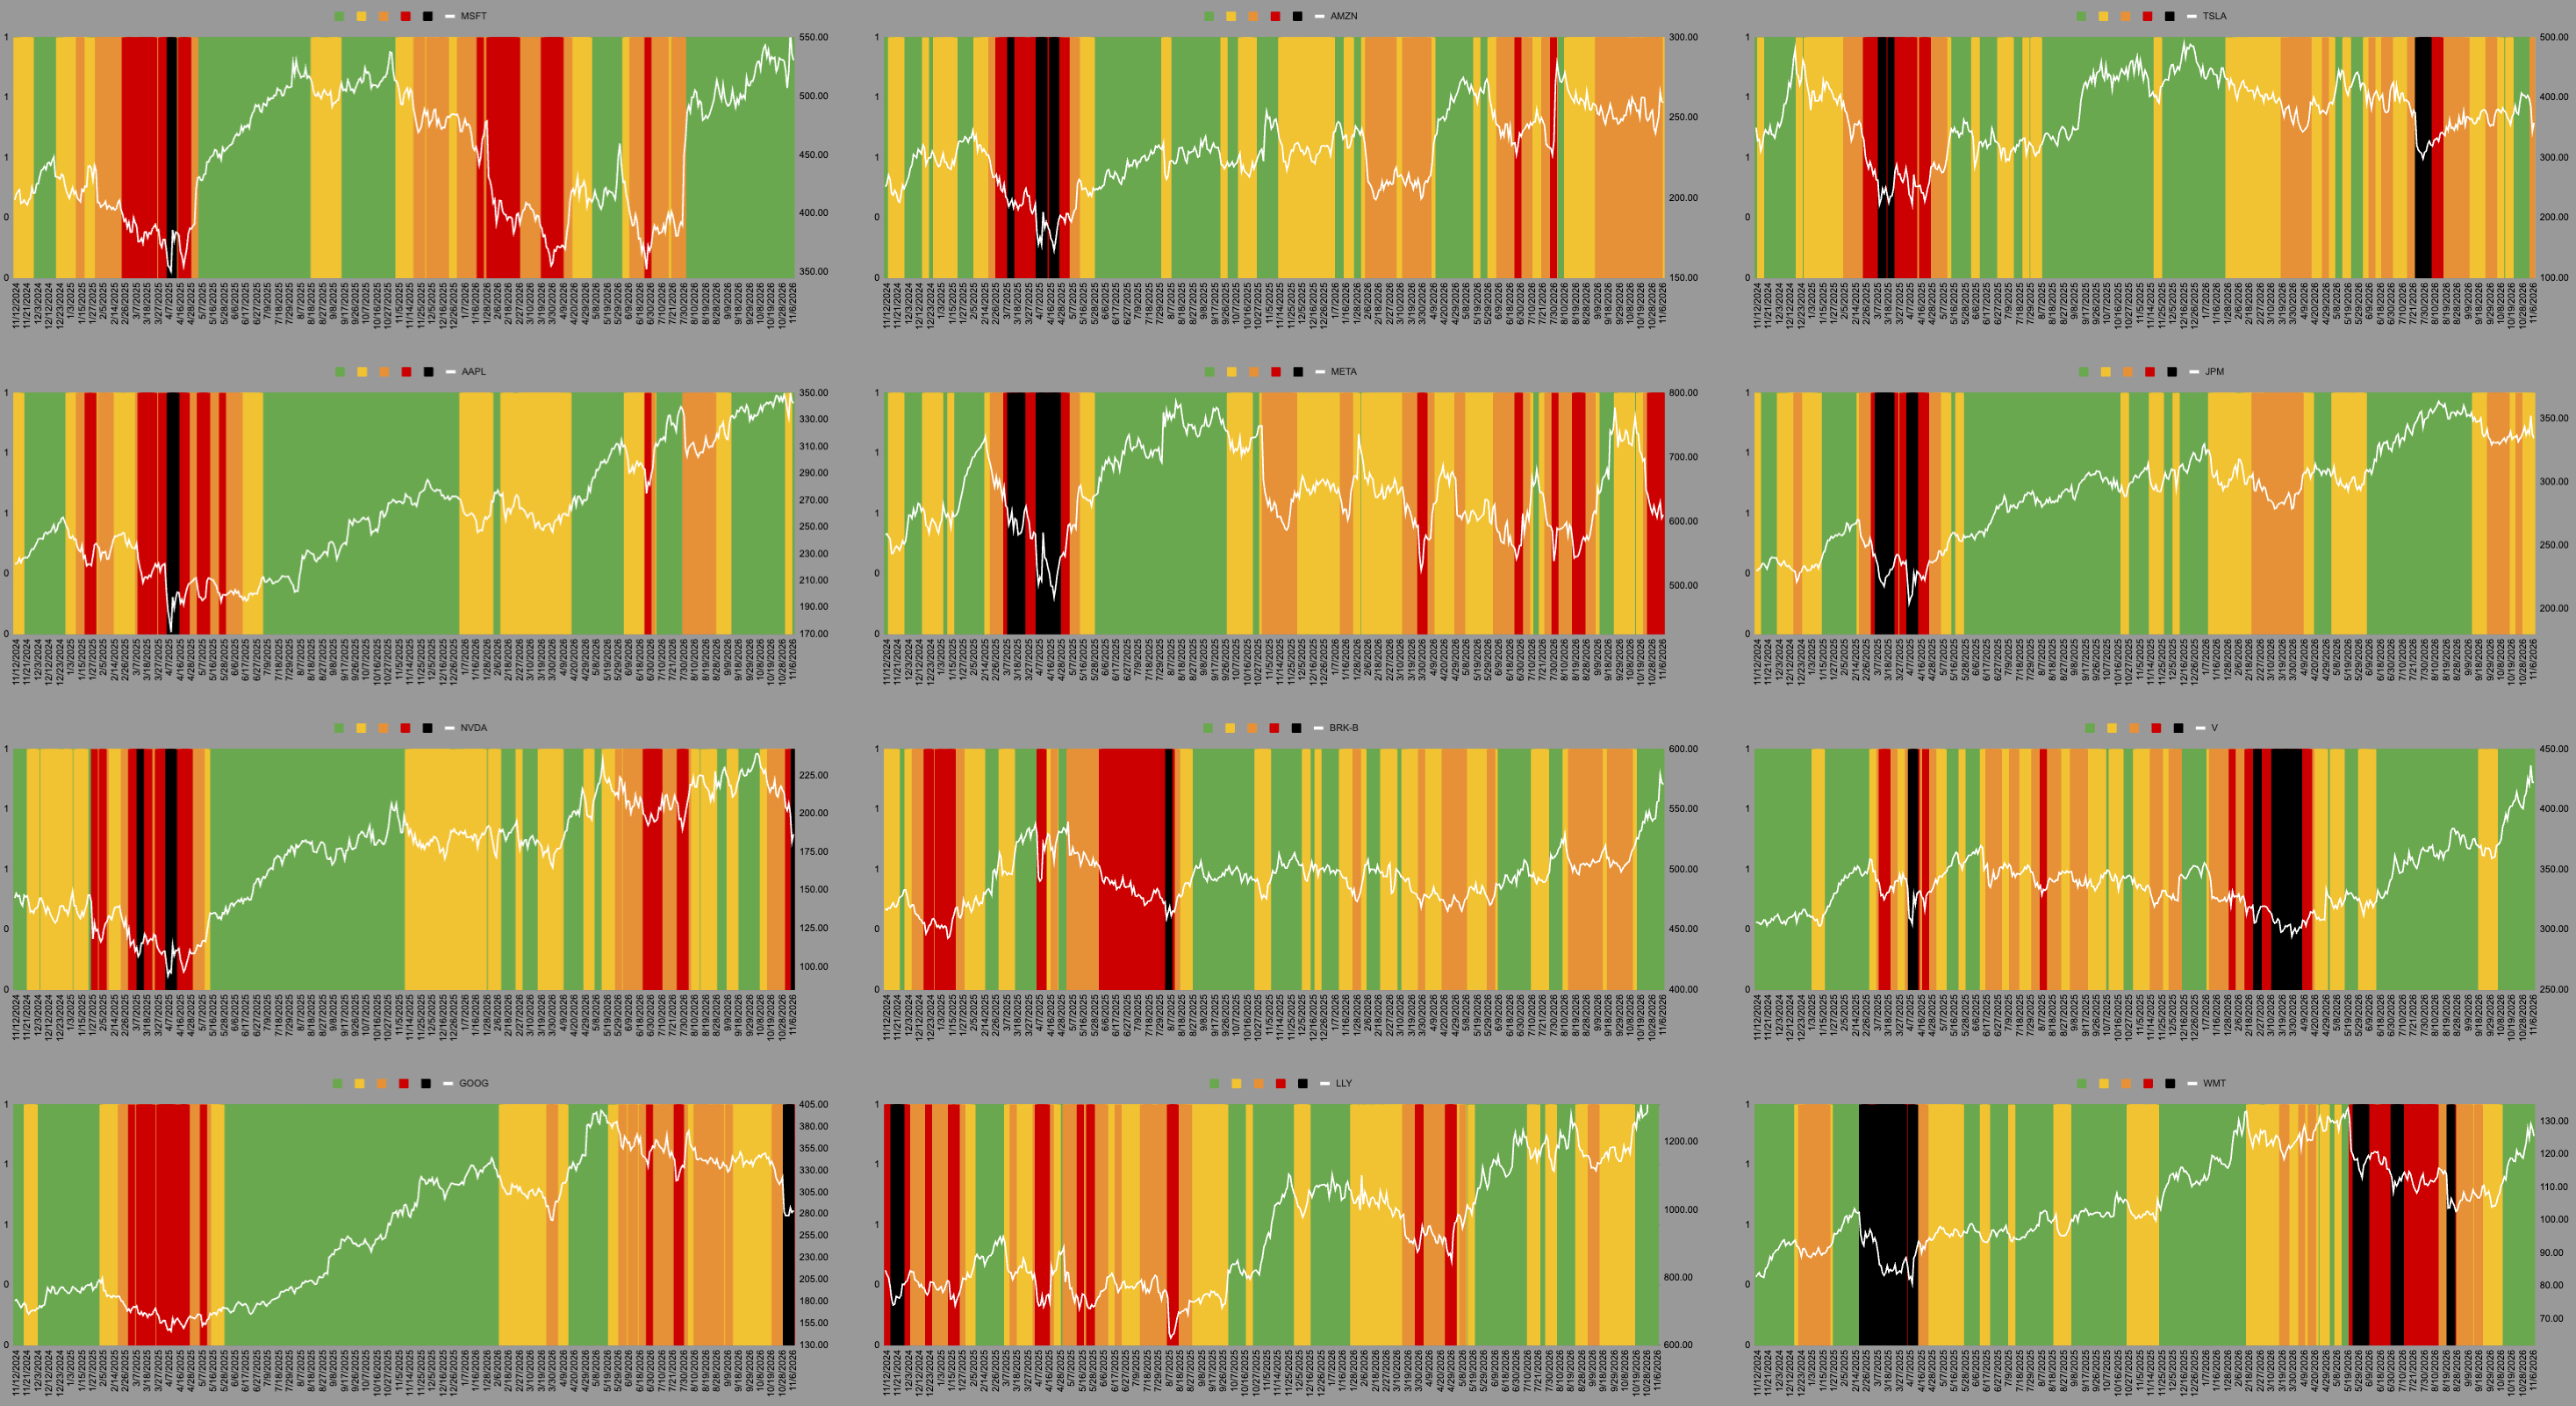
Back on subject, last week I showed you SMH well now NVDA has hit a “black line of doom”…
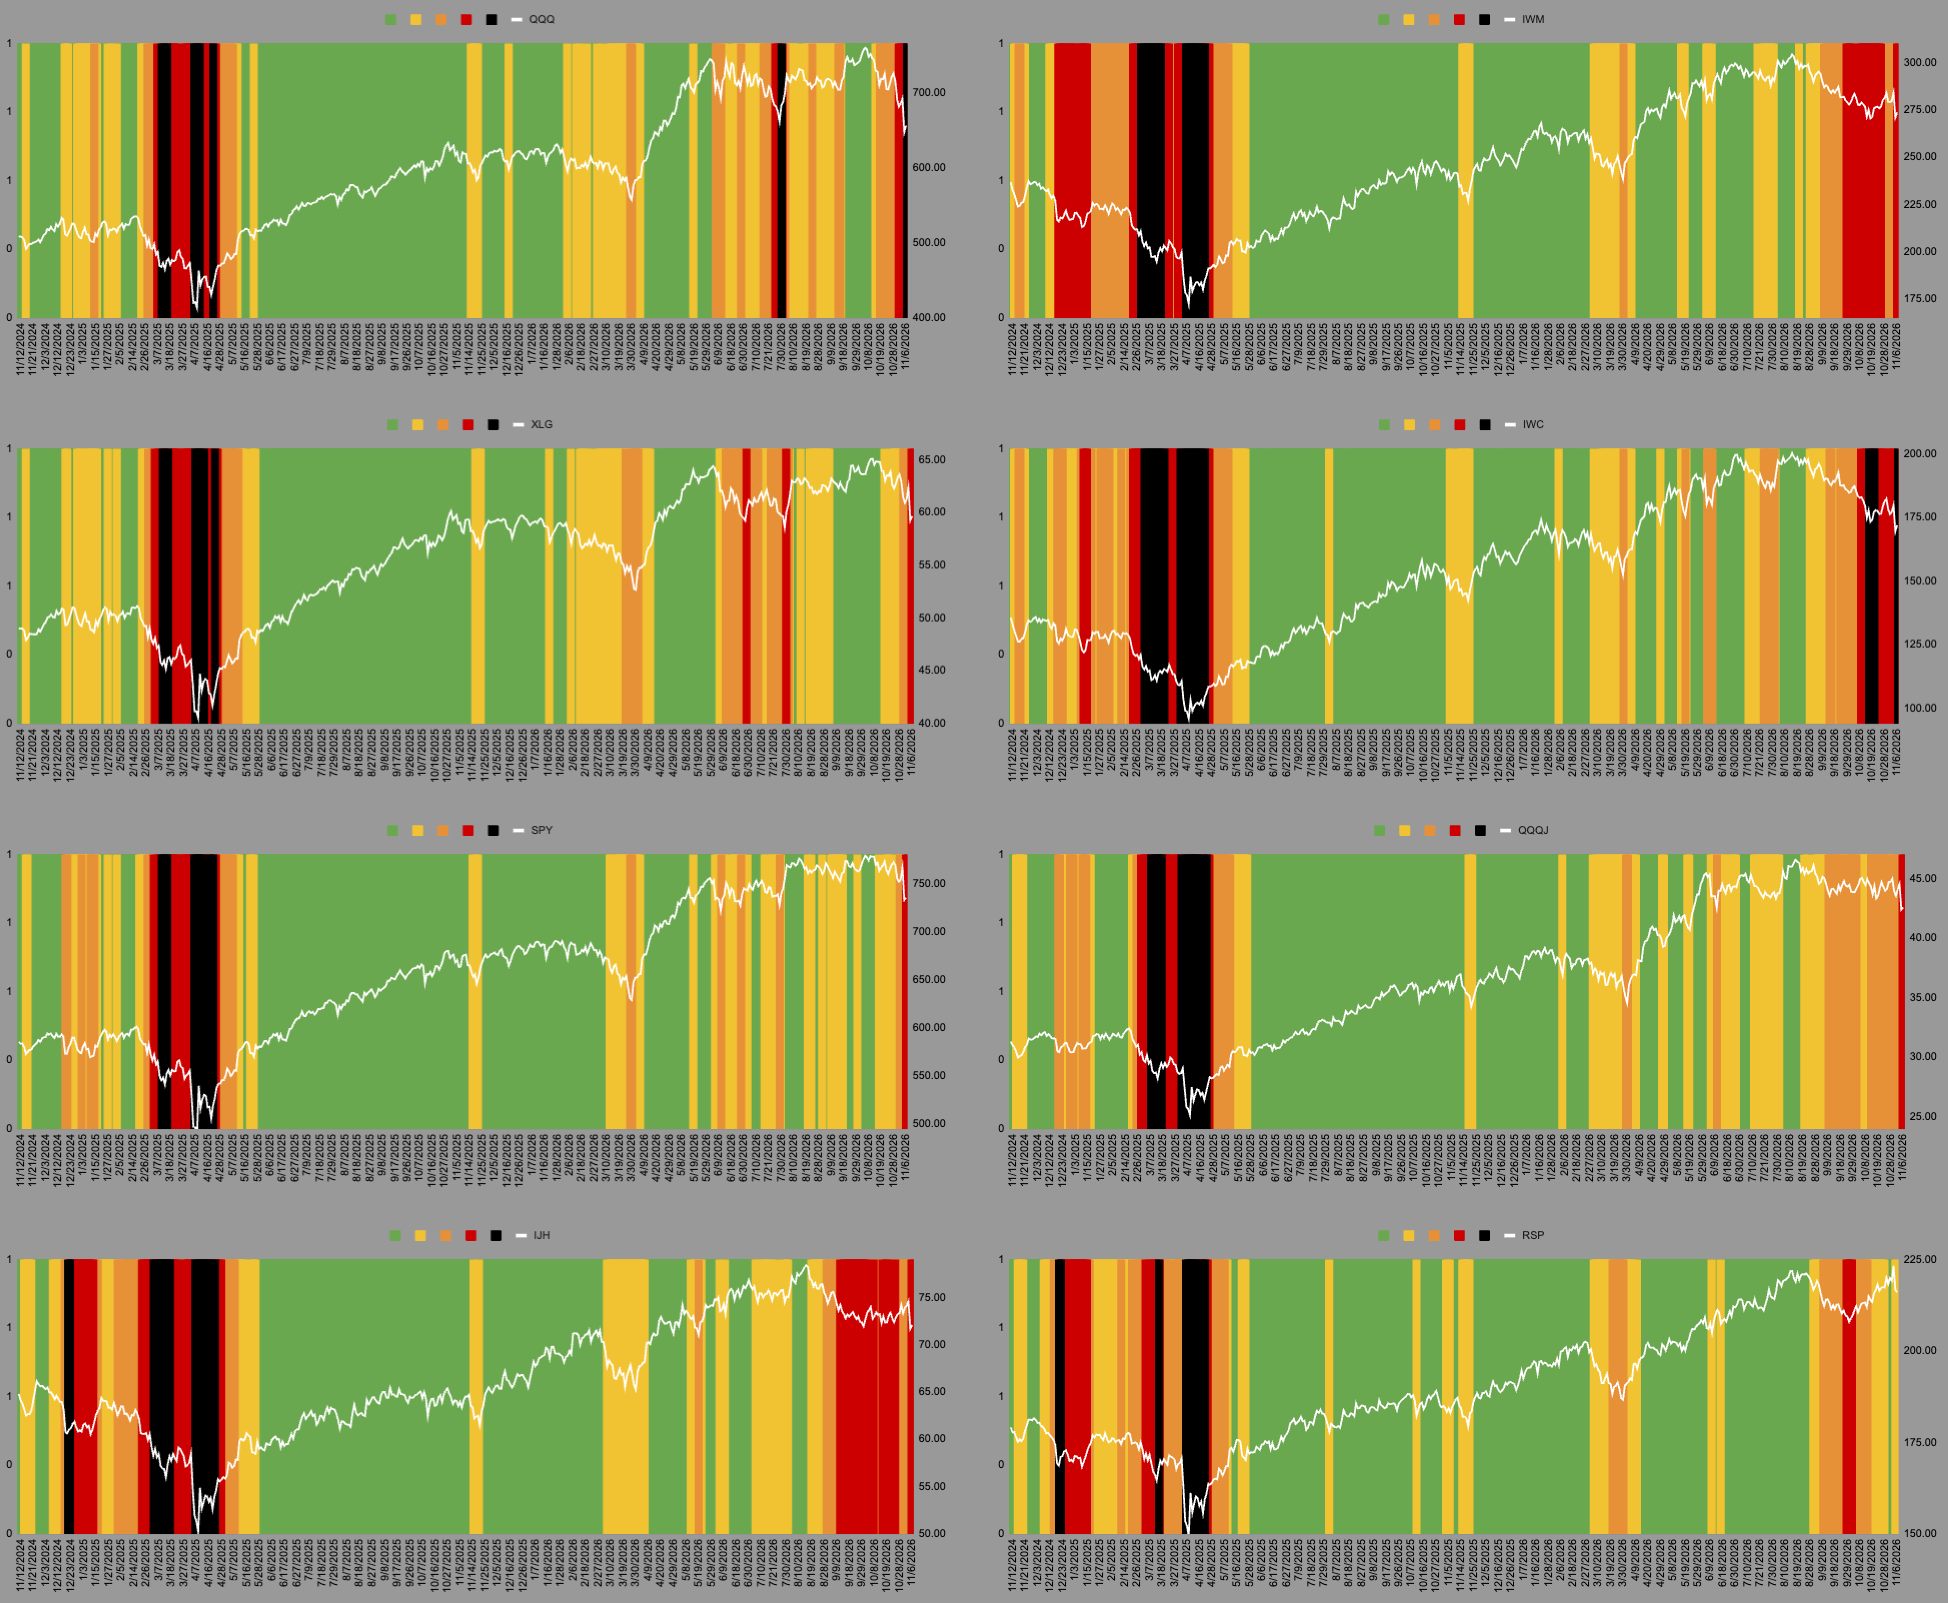
…QQQ getting in on the action.

And a whole bunch of other stuff.
I was wrong last week. There is a reason the backtests have 1, 5, 10, 20 and 60 day expected returns..
Could we be cut by both edges of the sword?
Selling too late into the face of a bounce.