I advise using the app/website as emails are often truncated due to images!
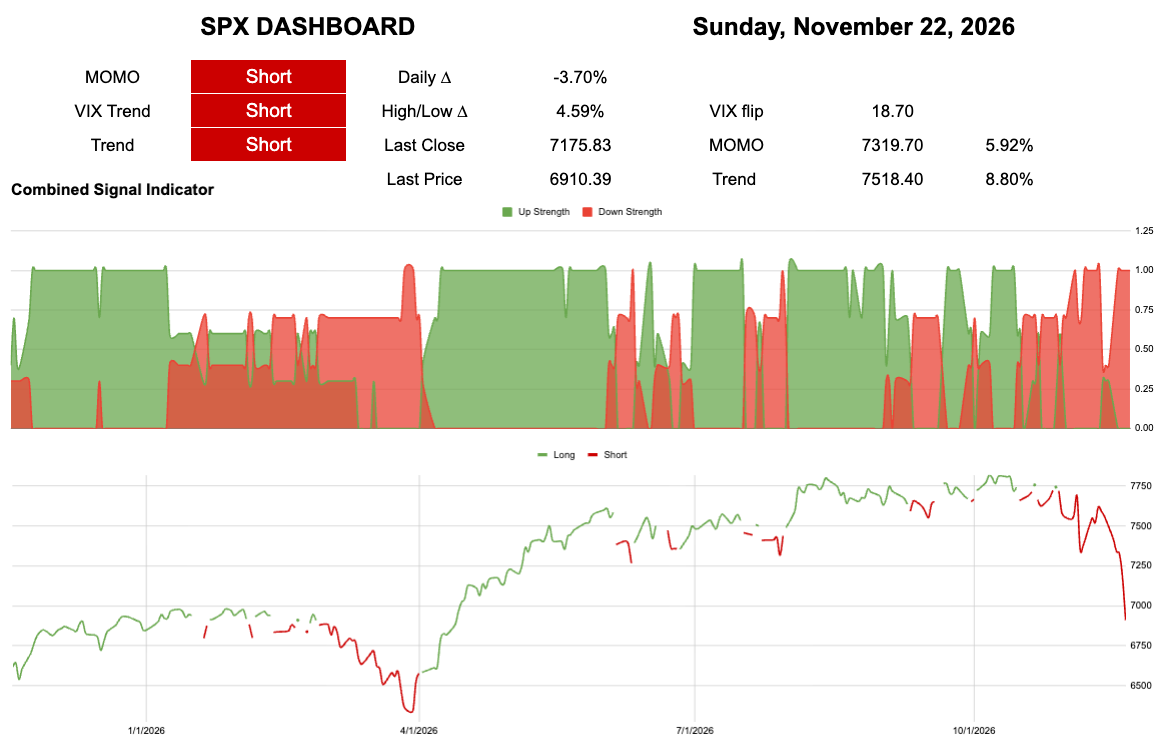
TL;DR I guess it was 2018 after all..
The dot is Black
Trend is 752.90
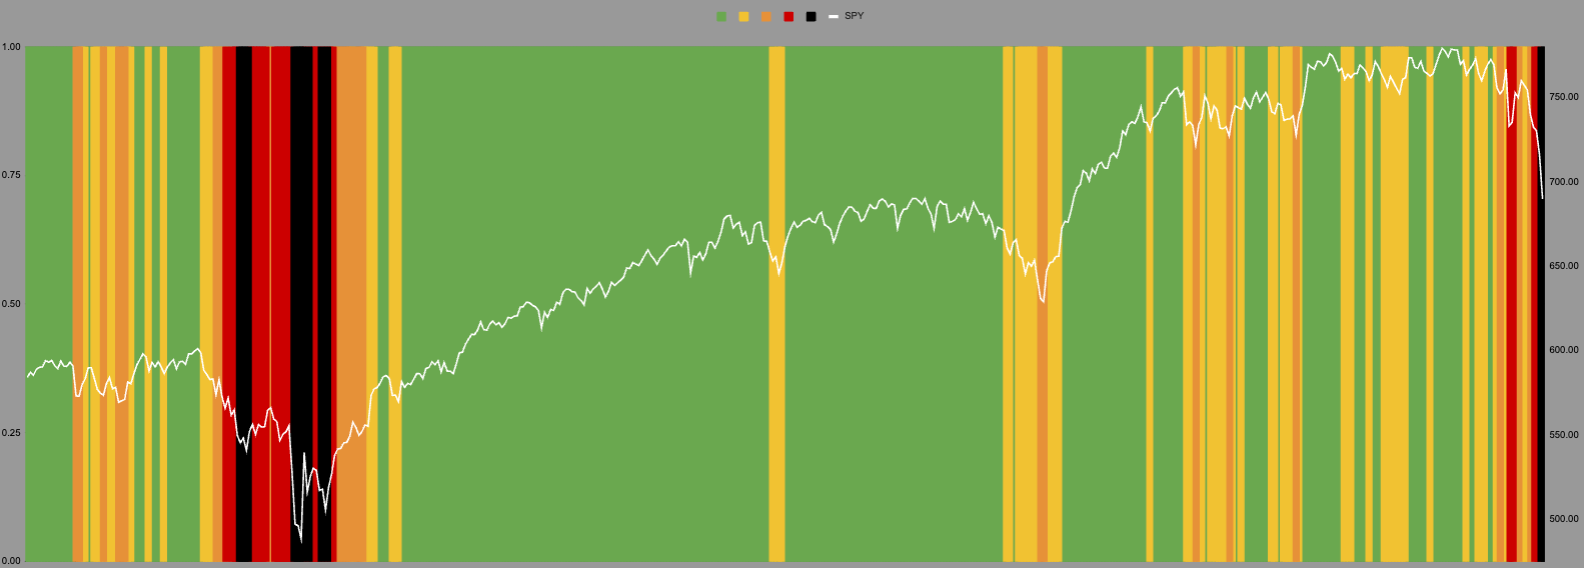
I went back to this style of chart this week to make it a little easier to explain. We have had a big break of trend and a black line of doom. I hold my hands up I did not think this would come this side of Xmas. I was wrong.
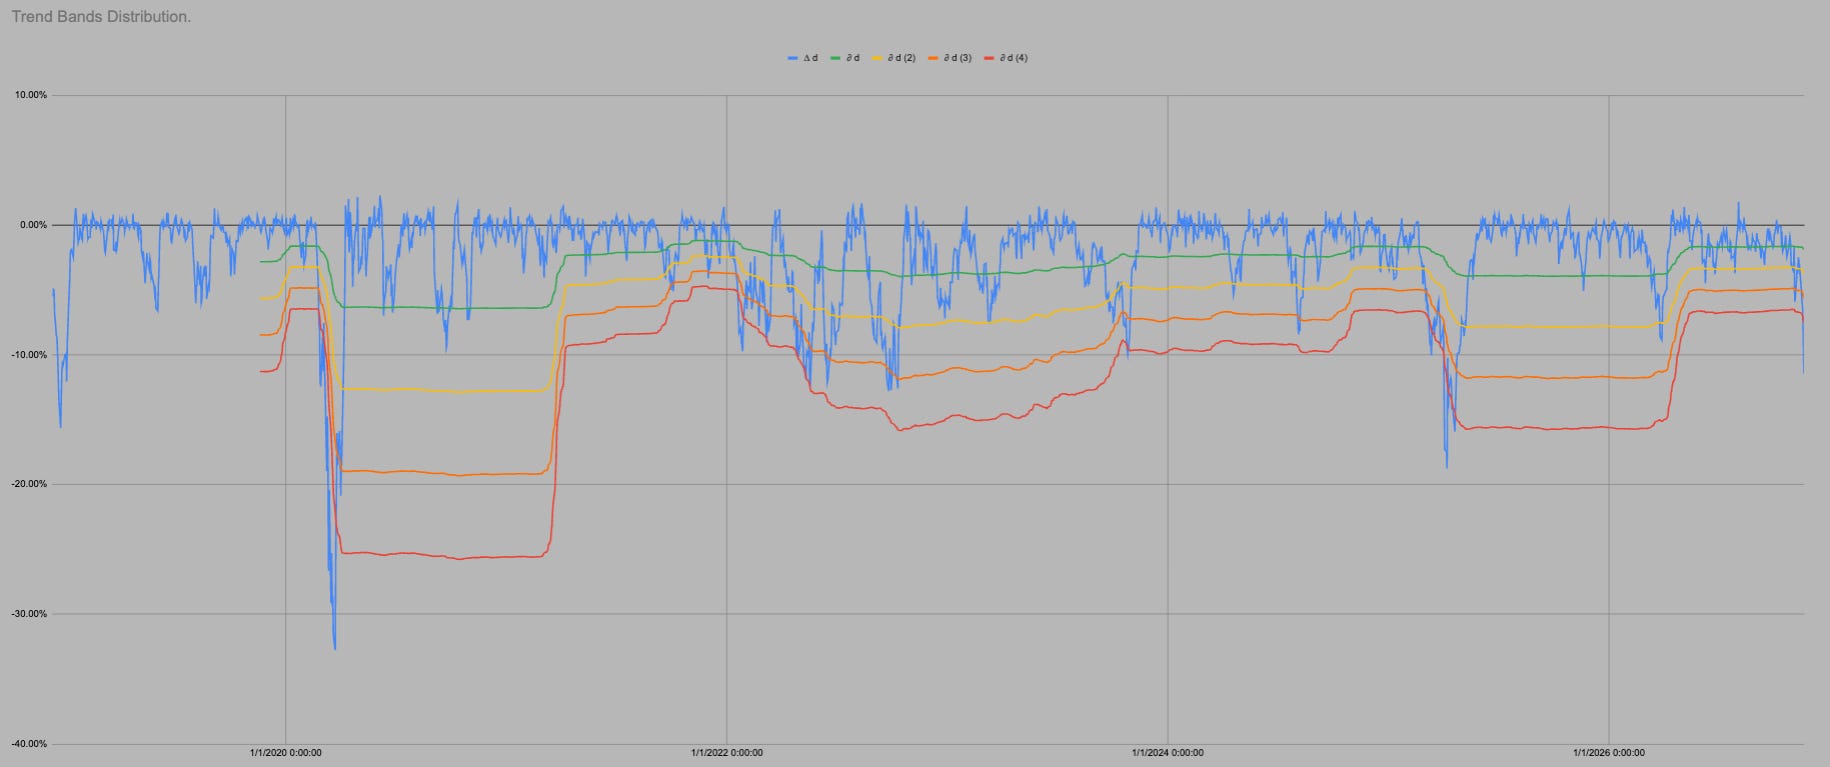
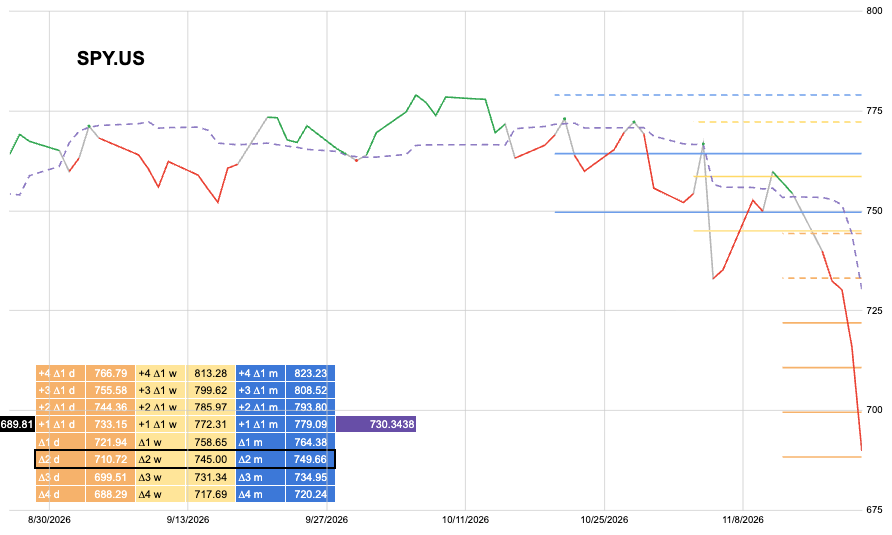
You can see that our trend lines have started to turn down.
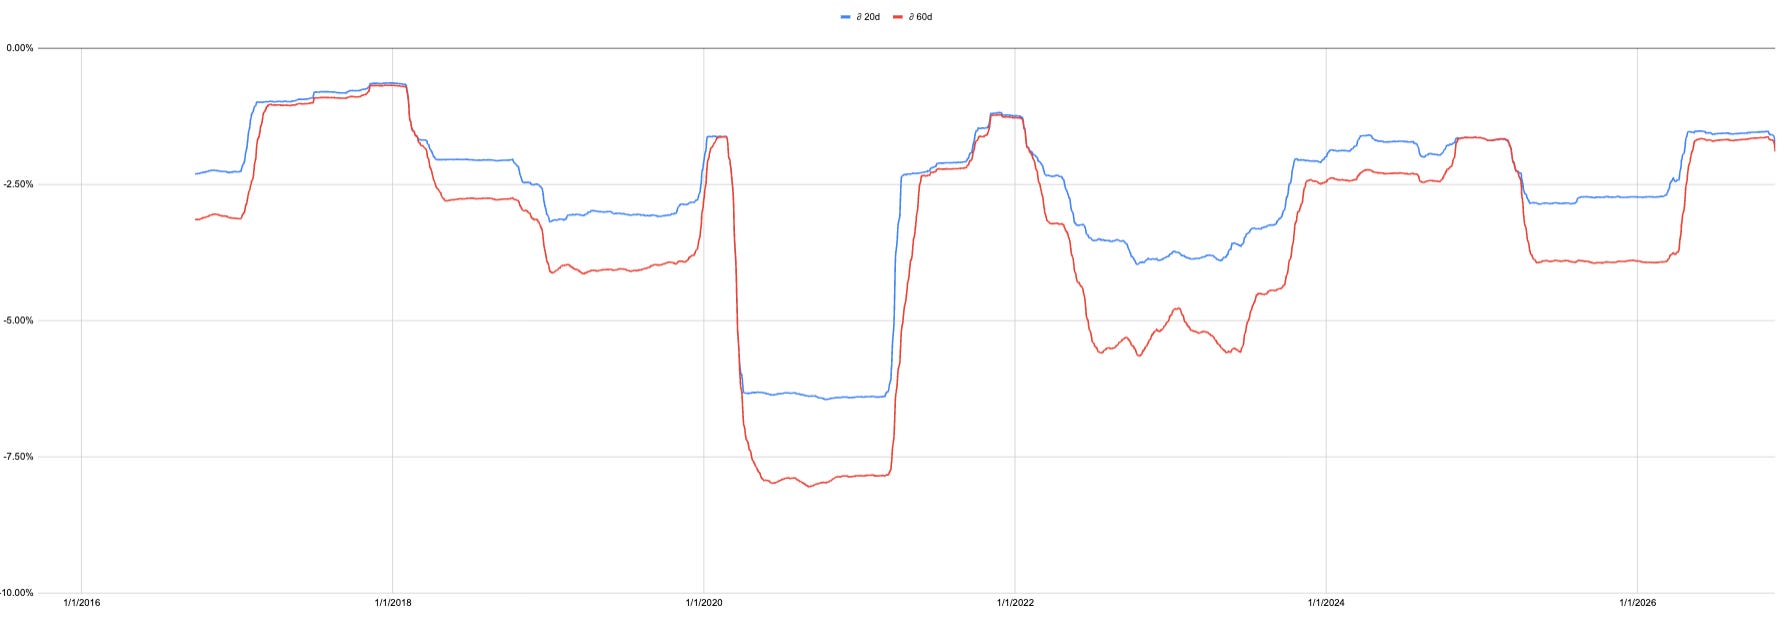
Here is a chart of our primary trend measure but over two timeframes. This combination of timeframes adds to this expanding and contracting volume regimes I bang on about..
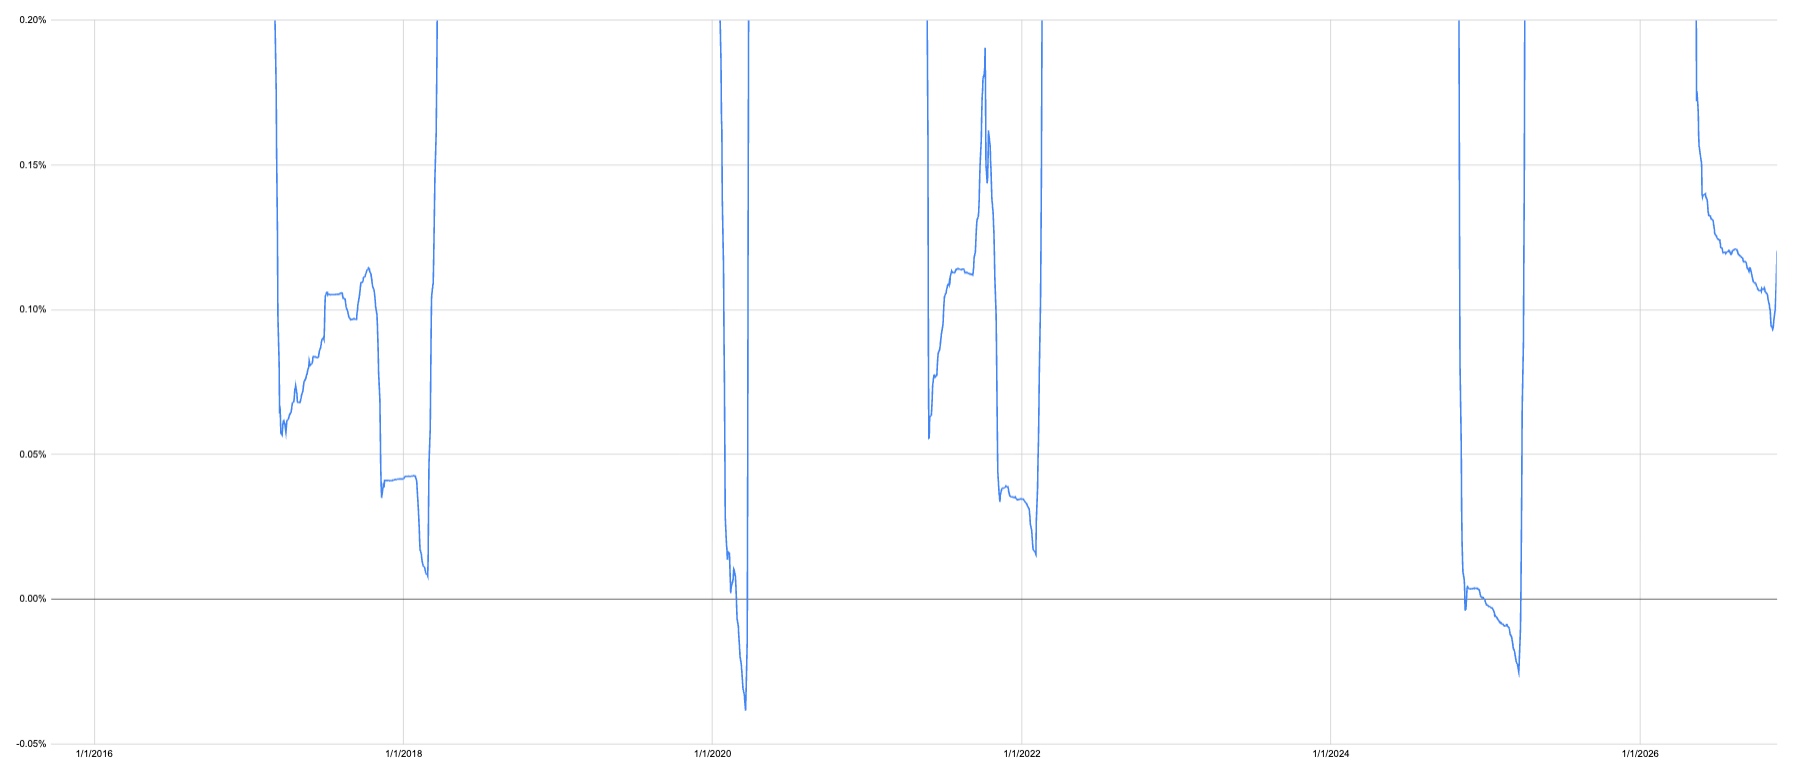
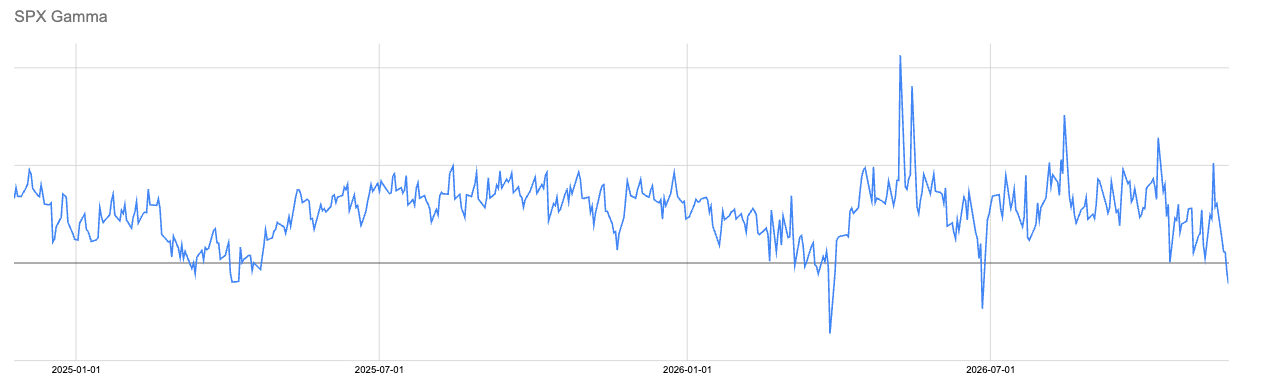
A couple of months ago a shared this wonky chart which tracks the relationship between the two timeframes of trend. I pointed out we normally get this slow trickle lower as they slowly come together i.e. multiple timeframes of trend converge to a similar price. Then it spikes higher as it has in the last few days.
What to do with this nonsense?
I am out of everything SPY related The double edged sword is still in play, just like with Gold at the start of this year.
Black line of doom is a bounce indicator for a reason!
The risk greater than it was last week ironically is a bounce. Your hedge this week would be calls not puts. If you are already out and in cash the pain trade is that the market goes up, not that you haven’t been short.
SPY spends 81% of all trading days above this level.

It is all the same chart so I can use all the same data. In the last 1761 trading days SPY has been above “trend” i.e. in green or yellow 81% of days.
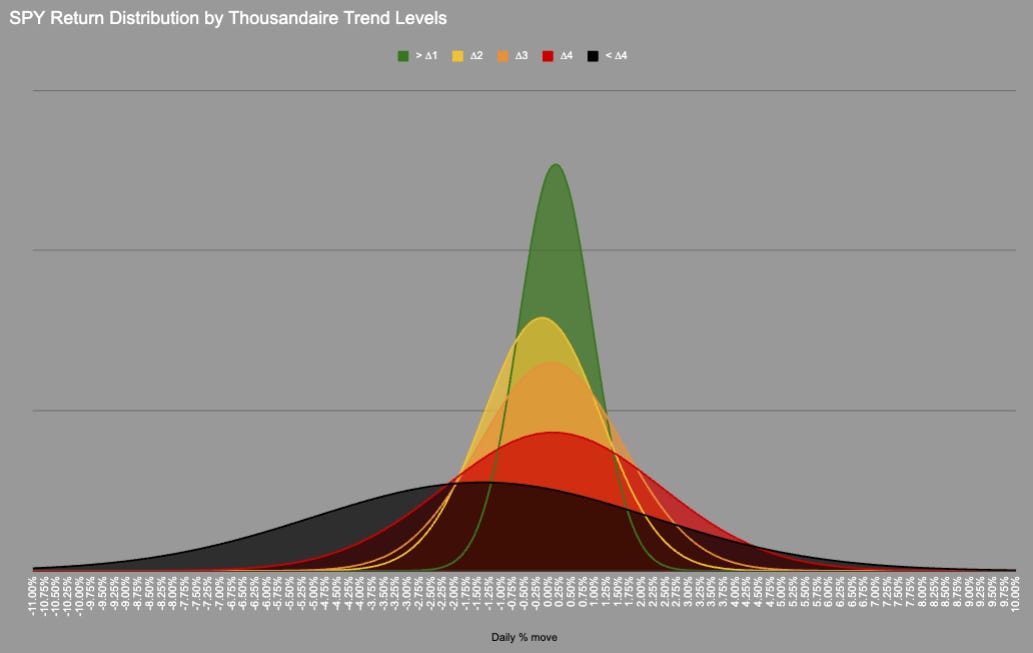
We could probably include orange as the distribution is very similar, but we need a transition point.
In 1761 trading days price has never moved directly from Green into Red/Black there is always an intermezzo hangout in Orange.
KeepItSimpleSubstack

Hot Takes with Hank
Think pieces!