Seasonality Season September Edition
It seems I like reusing titles...
Seasonality is actually quite simple. You buy when history shows that, on average, the market was strong, and you sell before periods of weakness. Easy, right?
Well, maybe not entirely. There are bumps in the road. What if we smooth them out with a long stock position and an options overlay to reduce the volatility of the equity curve?
FFS I give up.
Or, I could just ignore the last chart and sell you a product based on the second one.
Last week, I briefly touched on the pitfalls of blindly trusting a backtest.
Do I use backtests? Yes. It’s better to have a backtested process than not, but it’s not the holy grail.
Do you use seasonality? Yes. It’s better to understand seasonality than to pretend it doesn’t exist and risk being blindsided by it.
The reality is that, just like different equity sectors go through periods of working or not working (and we’re all happy to play that game), various market factors also cycle through periods of greater relevance. They paint a more accurate picture of what's happening in the market at any given time.
Then there’s another layer to consider.
A combination of seasonality, sector performance, options positioning, and trend analysis tells the most complete story.
At any given time, different elements may take the lead. For example, last week, CTAs (Commodity Trading Advisors) came back into play during the third act, playing a larger role than they had in the last 4-6 weeks.
People like to think it's just one thing, especially if you're someone with a normal job who doesn't stare at charts all day. But even if one thing works 50% of the time, what if you could improve that just by adding one more factor?
Maybe I buy bullish straddles—one put and two calls—when both trend and momentum are positive. Or, perhaps I go long on futures when trend and momentum are positive, and I buy puts only during periods of negative seasonality.
What if we could achieve better returns by refining how and when we gain exposure to different factors, rather than frantically chasing the latest "must-have" investments?
I wonder how many people are still thriving from shorting at all-time highs?
I always try to walk a middle path. I might be very negative on the index but still hold 20-30 specific equities in the portfolio if they remain above my momentum and trend thresholds.
Daily
Hourly
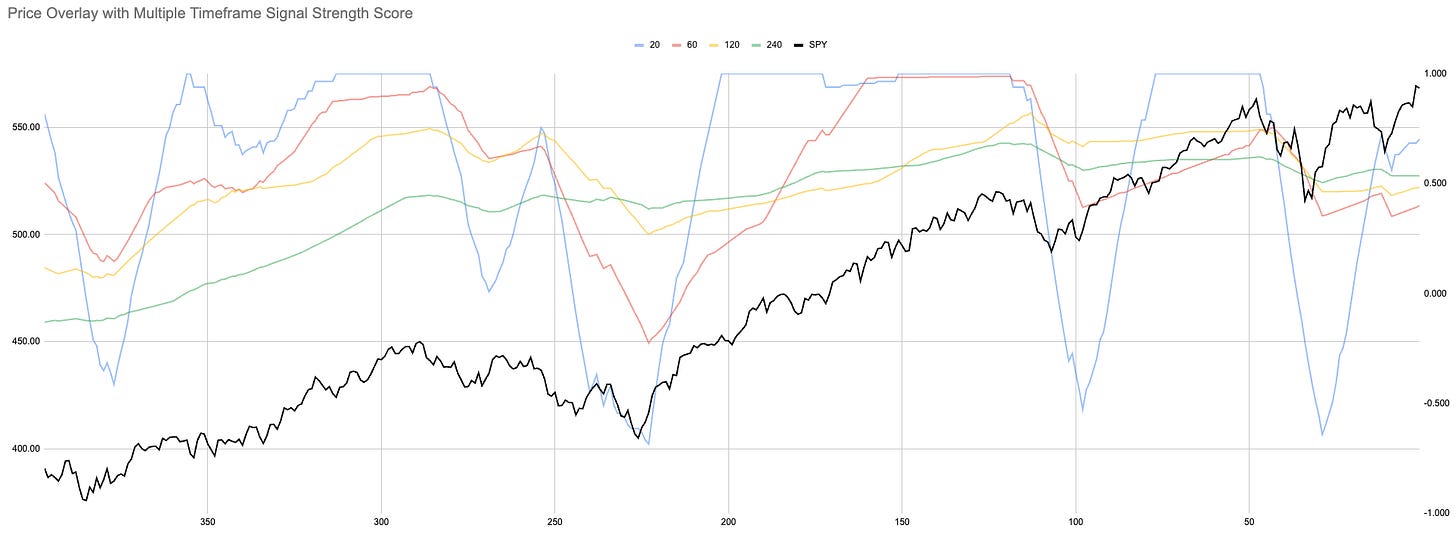
Daily and hourly charts are both green. For our system, these are the dominant measures, though we also track a very short-term 5-minute indicator.
Right now, we’re bullish on all measures, but we're stuck in the middle of the bands.
Nothing trades in isolation—this is one interconnected system. Some may focus on one part of the market, but that doesn’t mean we can ignore the rest.
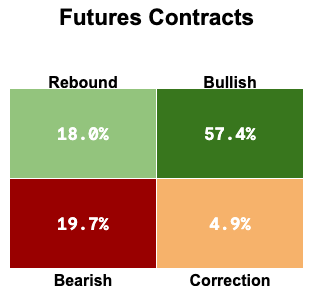
CTAs and Trend Followers are often the marginal buyers or sellers in the markets, driving momentum both upwards and downwards.
By my measure, CTAs could be up to 57% long right now.
Taking into account the interconnected nature of these systems, you can see a 50/50 split in crypto between BTC and ETH futures contracts.
Looking at crypto as a sector, platforms are currently the only undecided segment, with ETH falling within that sector.
Will platforms start to perform well due to some underlying fundamental factors? Or will they only rally if CTAs start to go long on ETH futures?
If you find any of this helpful, feel free to subscribe. Behind the paywall, I share how I would build a portfolio using some of this data as inputs.
I never set out to tell anyone what they should do—only to share how I see things and what I use to build my own process.
Use this as a guide to constructing your own approach, nothing more.
All of your investment decisions are yours alone, for better or for worse.


This is an insane(ly good) piece.
History rhymes - it's a good idea to know what the past playbooks were; however as you mention with all the different approaches you're never quite sure which playbook they'll use until it's rolled out.