Lightning Never Strikes the Same Place Twice
Weekly Portfolio Update
If you missed it, I made a video going over the S&P 500 data for this week.
Paid subscribers can use their links to view these charts in more detail.
So, please go and check it out.
The FOMO from crazy risk-on days hits us all, but do you know what I love more?
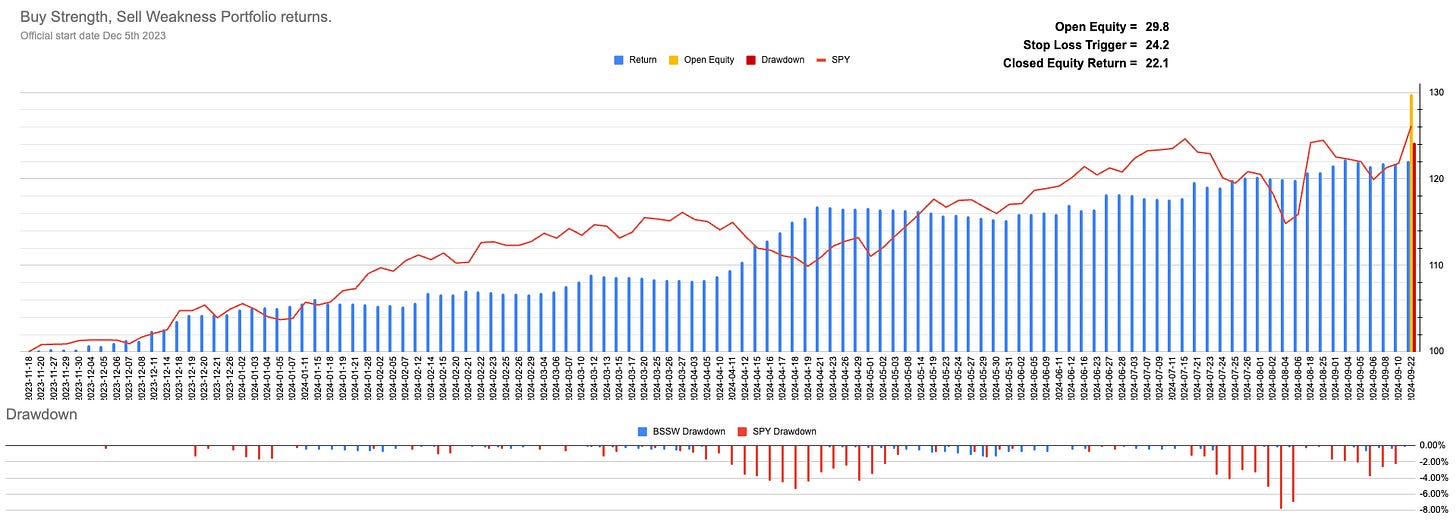
The fact that you can hardly see any of the little blue lines on this bottom chart.
It might seem like cheating to some to only show the drawdown of my closed returns. But to me, they belong to me, and I will guard them as such.
Open equity is just that—open. It still belongs to Mr. or Mrs. Market; it is not mine yet. In fact, if I get too possessive of those open gains, I might kill them off before they reach their full potential.
Current Closed Equity Return = 22.1%
Current Open Equity = 29.8%
Stop Loss Trigger = 24.2%


