
Options Adjusted Seasonality. Coin Flip?
Week 34 - Equity Portfolio Update

I highly recommend using the link to view these posts in a desktop browser. Substack limits the size of emails, and since I use a lot of images, some readers have been missing important data by only viewing the truncated email.
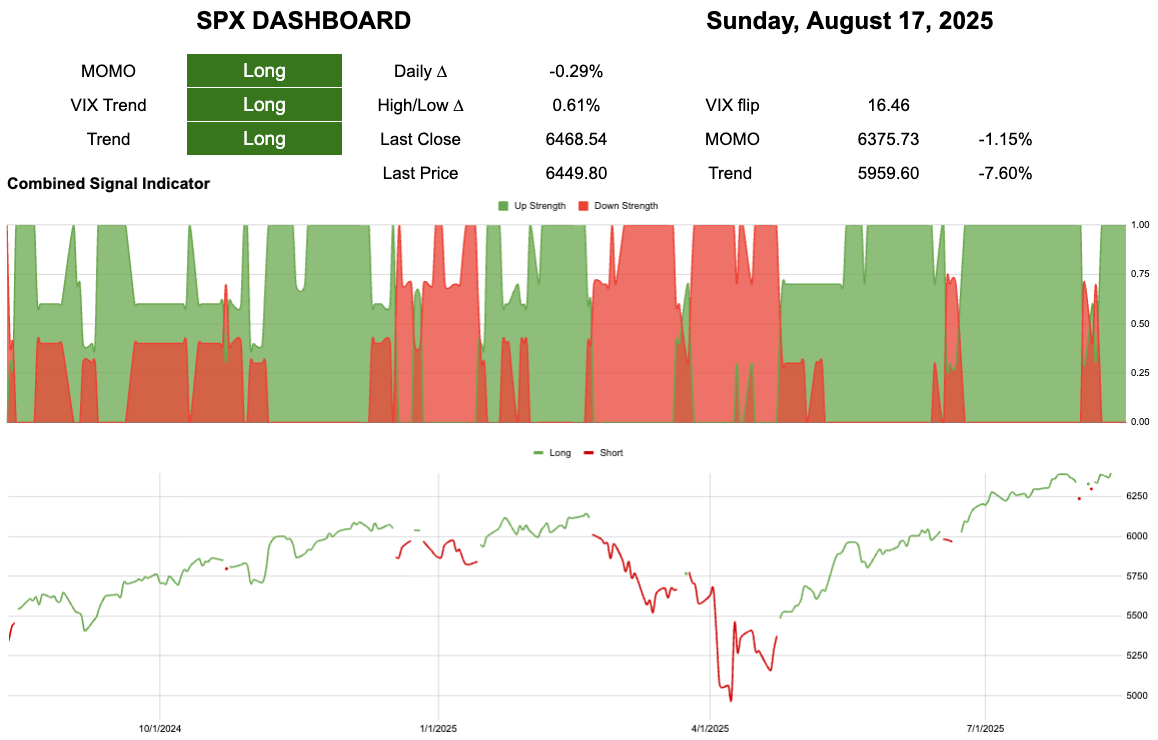
All green on the board again after a short term wiggle.
6375 to break momentum
5959 to break trend
All Strength of Signal (SoS) are rising.
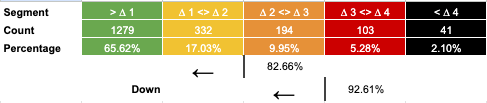
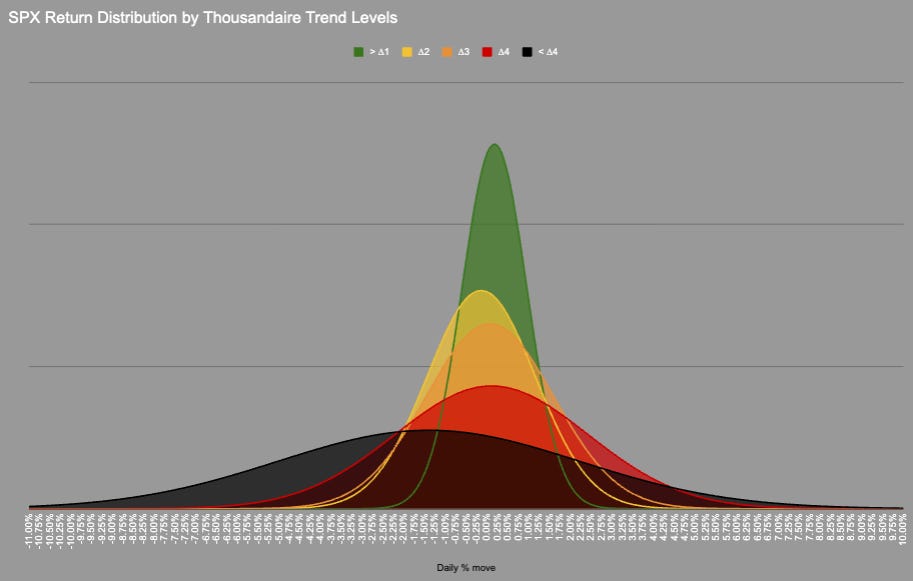
We remain in the green zone where SPX spends 65% of its trading time. This zone has a narrow but positively skewed distribution.
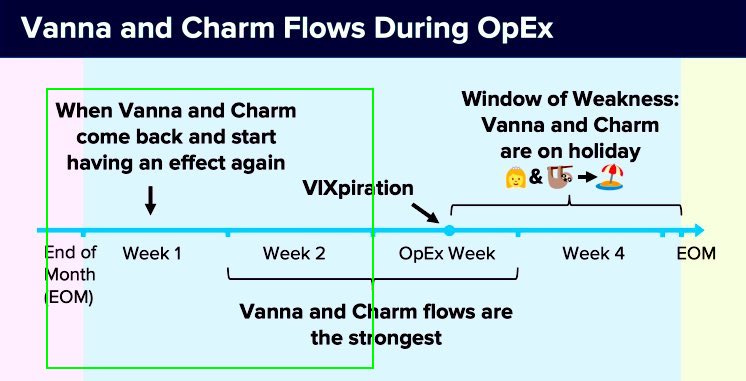
Mr Croissant says Vanna and Charm are strongest.
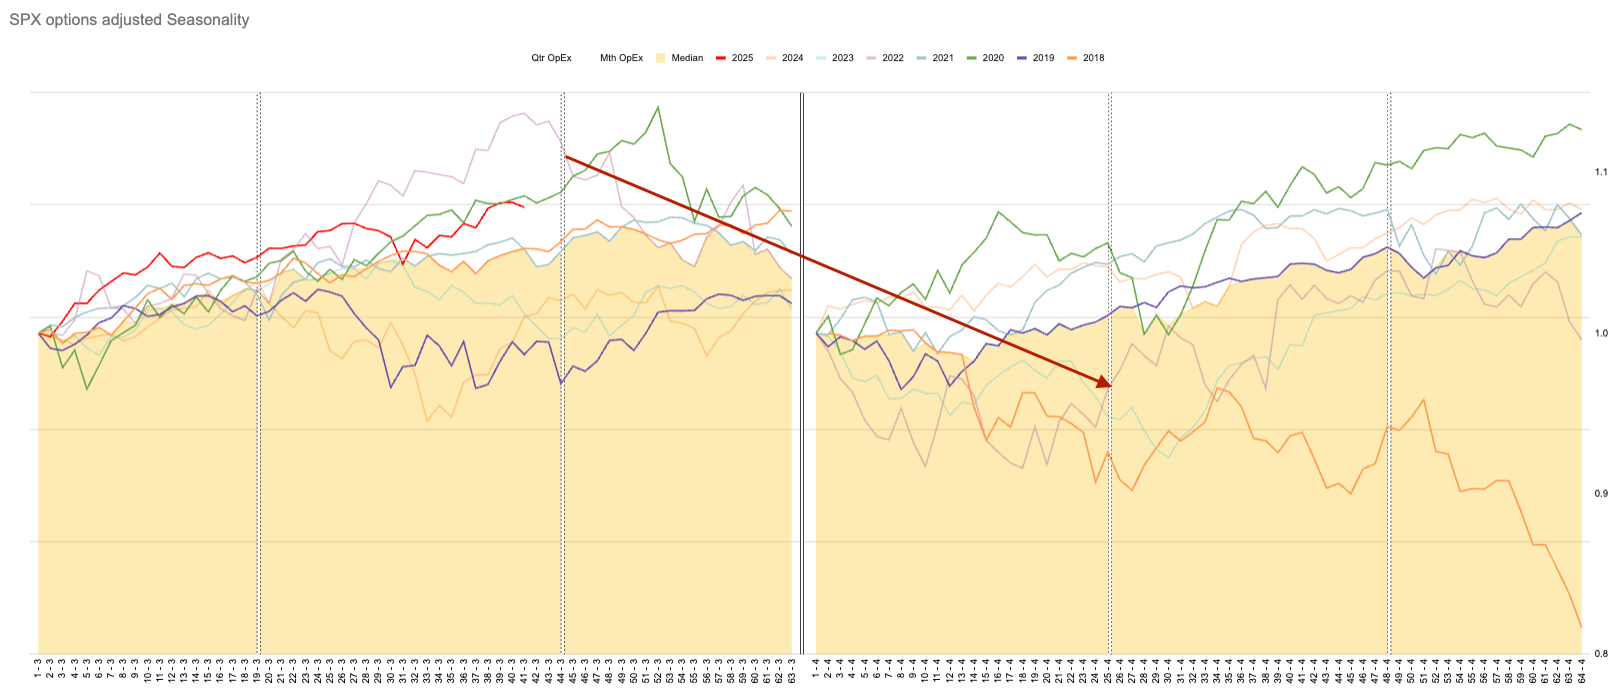
If we look at seasonality adjusted for options expiry as opposed to direct calendar dates, we see that August through the much larger September expiry can be a turning point. Years that have been can become weak and weak years can see strength. Lets see how this all plays out.
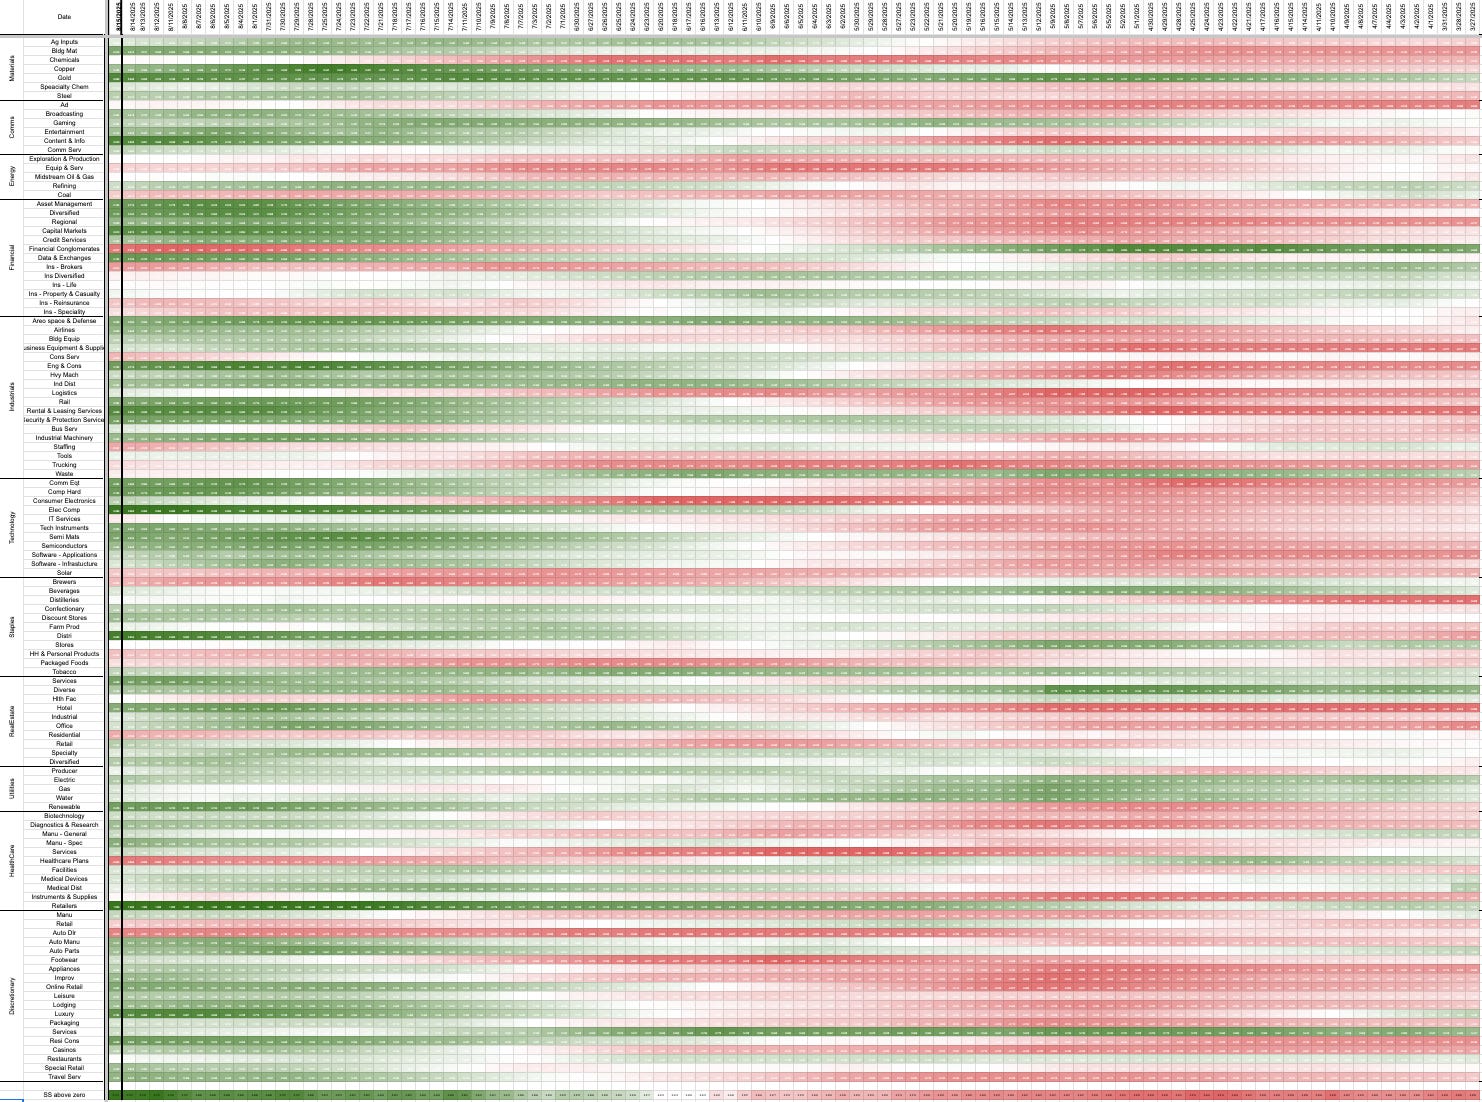
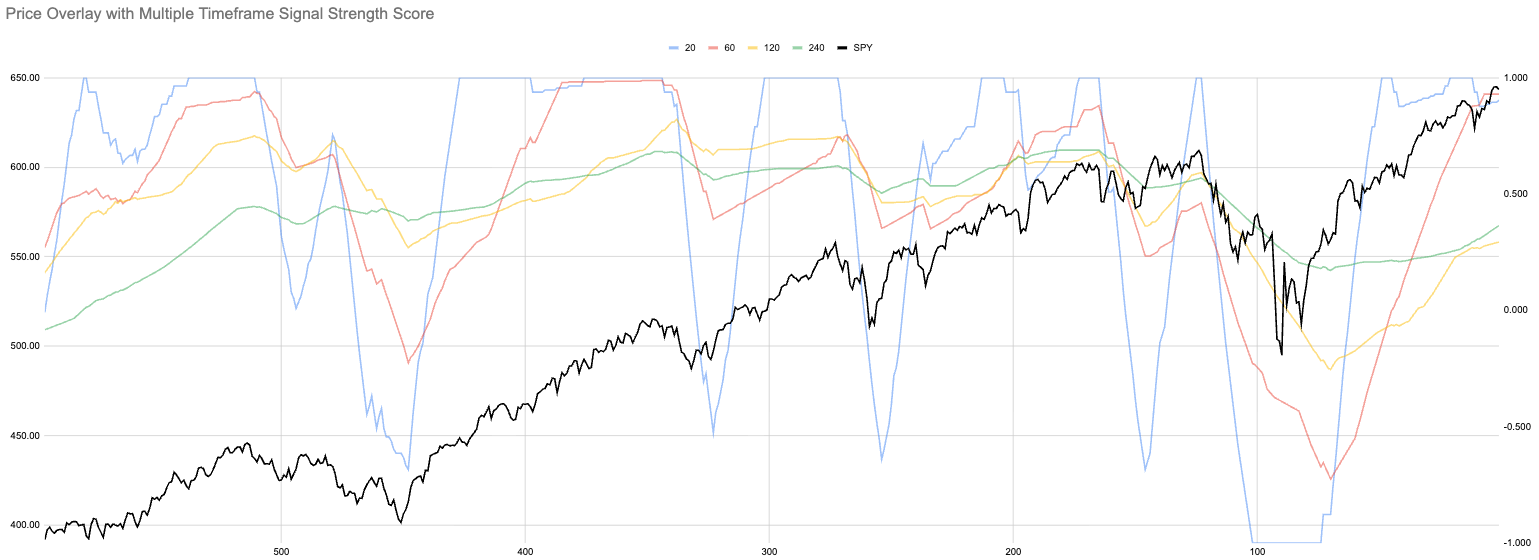
This is a “chart for ants”!

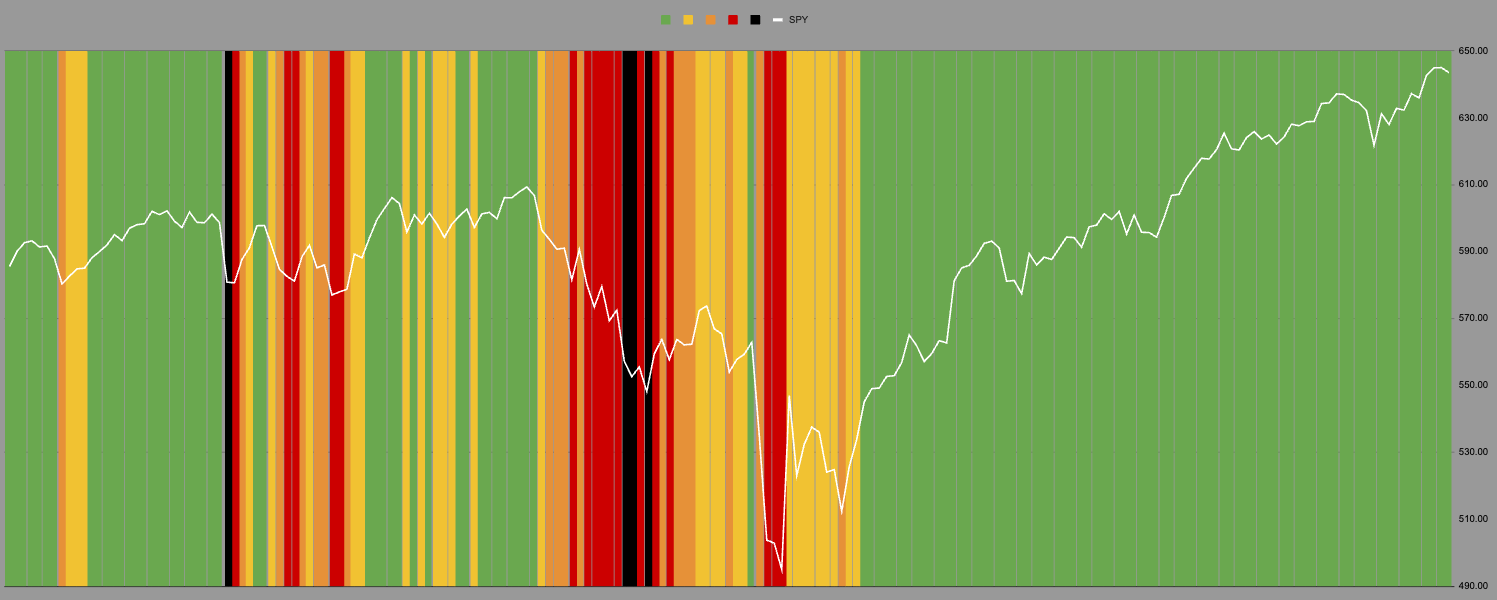
Most recent values on the left. The SP500 split into sub-industries of the 500 tickers. You can see the shift as we moved through the start of the year, of falling negative strength of signal.
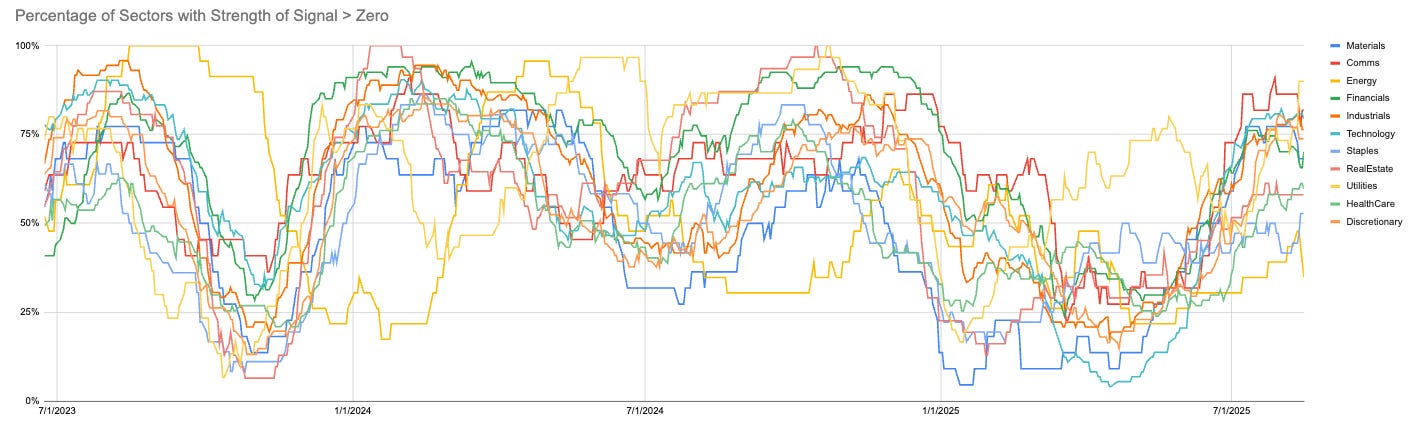
Since April we have seen a big pickup.
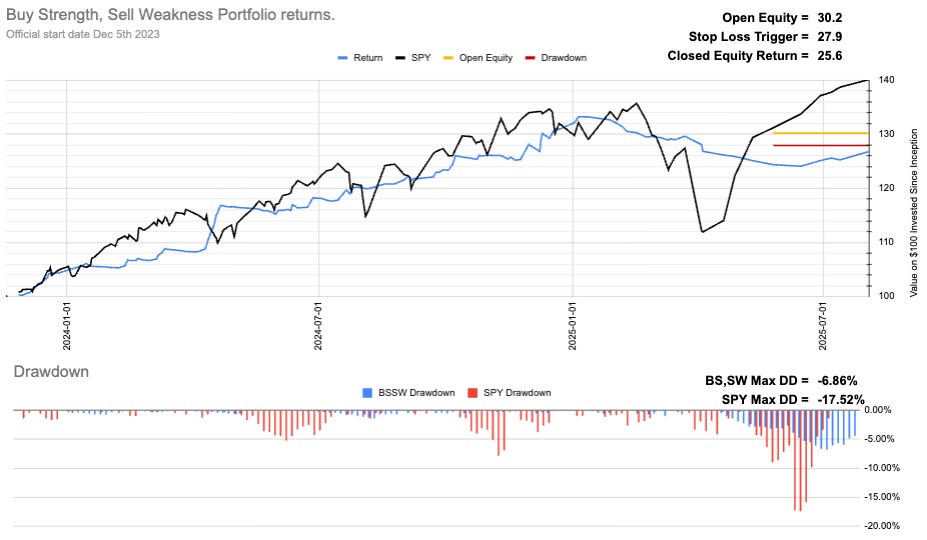
Current Open Equity = 30.2%
Stop Loss Trigger = 27.9%
Current Closed Equity Return = 25.6%
Our open equity outstanding is ~30% since we started in Dec ‘23. We have been able to capture ~26% returns in closed trades, meaning ~4% open equity still belongs to Mr Market. Until we close the trade it doesn’t yet belong to us!
Subscribe to see the portfolio. You can do it for free using the 7-day trial if you want.
New user guide - Paid Portfolio Posts

Hot Takes with Hank
Think pieces!


