Monday Morning Index Intro
Monday 14th October - Daily Update
5682 - 5713 is the line in the sand by measure of trend and momentum.
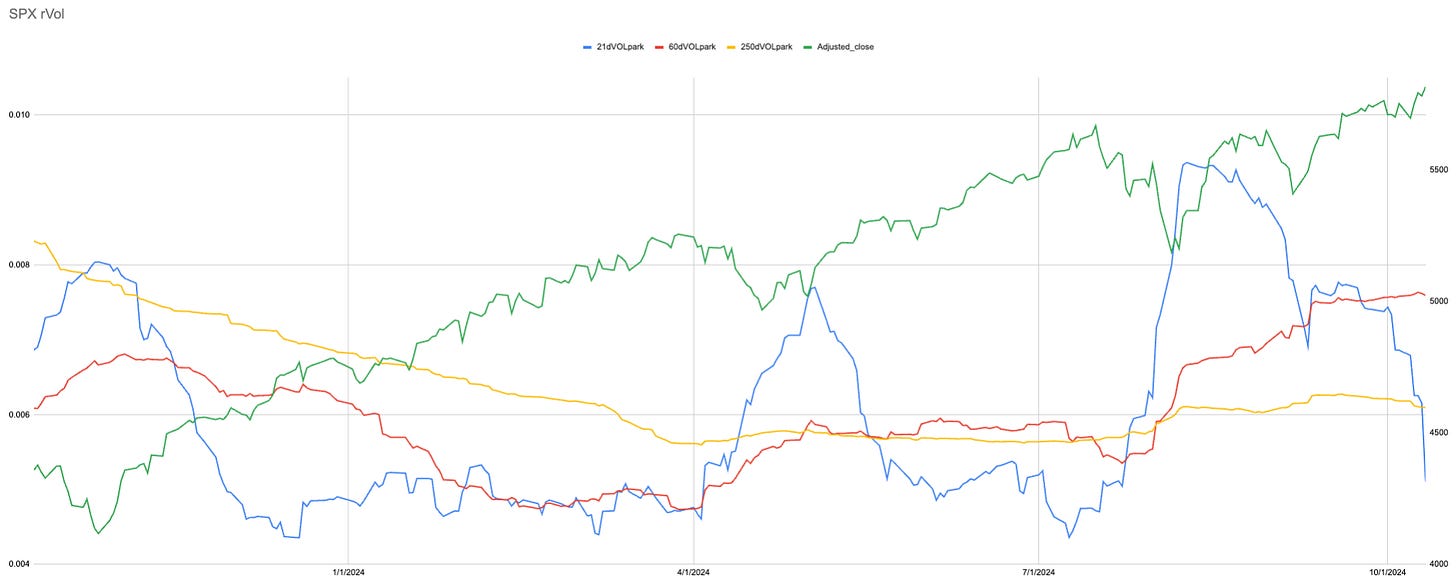
As I highlighted last week realised volatility continues to fall.
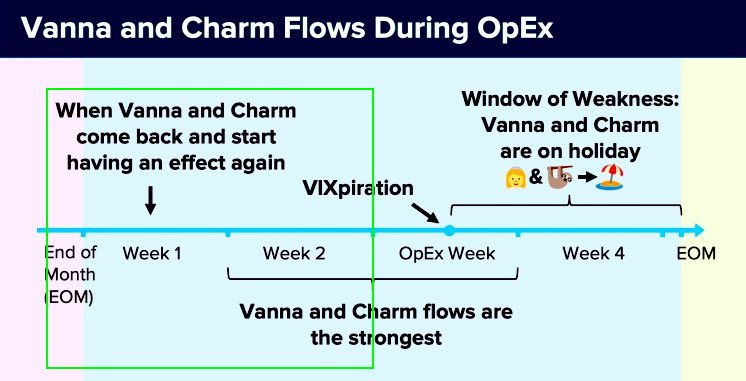
We remain until Wednesday in Mr Croissants strong options flows window.
Daily
This chart is visual of the below. Green is Bullish i.e. ST and LT momentum indicators are rising. Red is ST and LT falling. The gaps in between are either rebound or correction.
Hourly
I am working on an index-only cheatsheet. Constantly posting screenshots is tiresome and of course, everyone is only interested in today :)
As old numbers disappear the calculations can shift more than most recent moves would make you think.
New ATHs make it easier though.
Just because the line is moving higher does mean we are heading to 608. The more important will be the lower value Daily B 554.
This means several things:
It is a measure of where the SPY spends ~83% of trading time above so can act as possible support.
As old lower prices fall out of the calculation window it will keep moving higher.
This will “lift” support moving forward.
Moving through time it means price will also get closer to breaking even without the price going down.
Portfolio Rerank
New user guide
Current Closed Equity Return = 25.8%
Current Open Equity = 32.1%
Stop Loss Trigger = 27%
New subscribers make sure to join Discord using this link https://discord.gg/zGwDrkUG Send me a DM if you are a paid subscriber with your substack email and I will add you to the paid section.
This is not some daily trading discord throwing tickers around.
It is a way to connect a little easier than Substack messages and I share things in there as I see different things in the market.


