
$LULU Ladies go Woo Woo for LULU
Equity Spotlight
…or at least they used to.
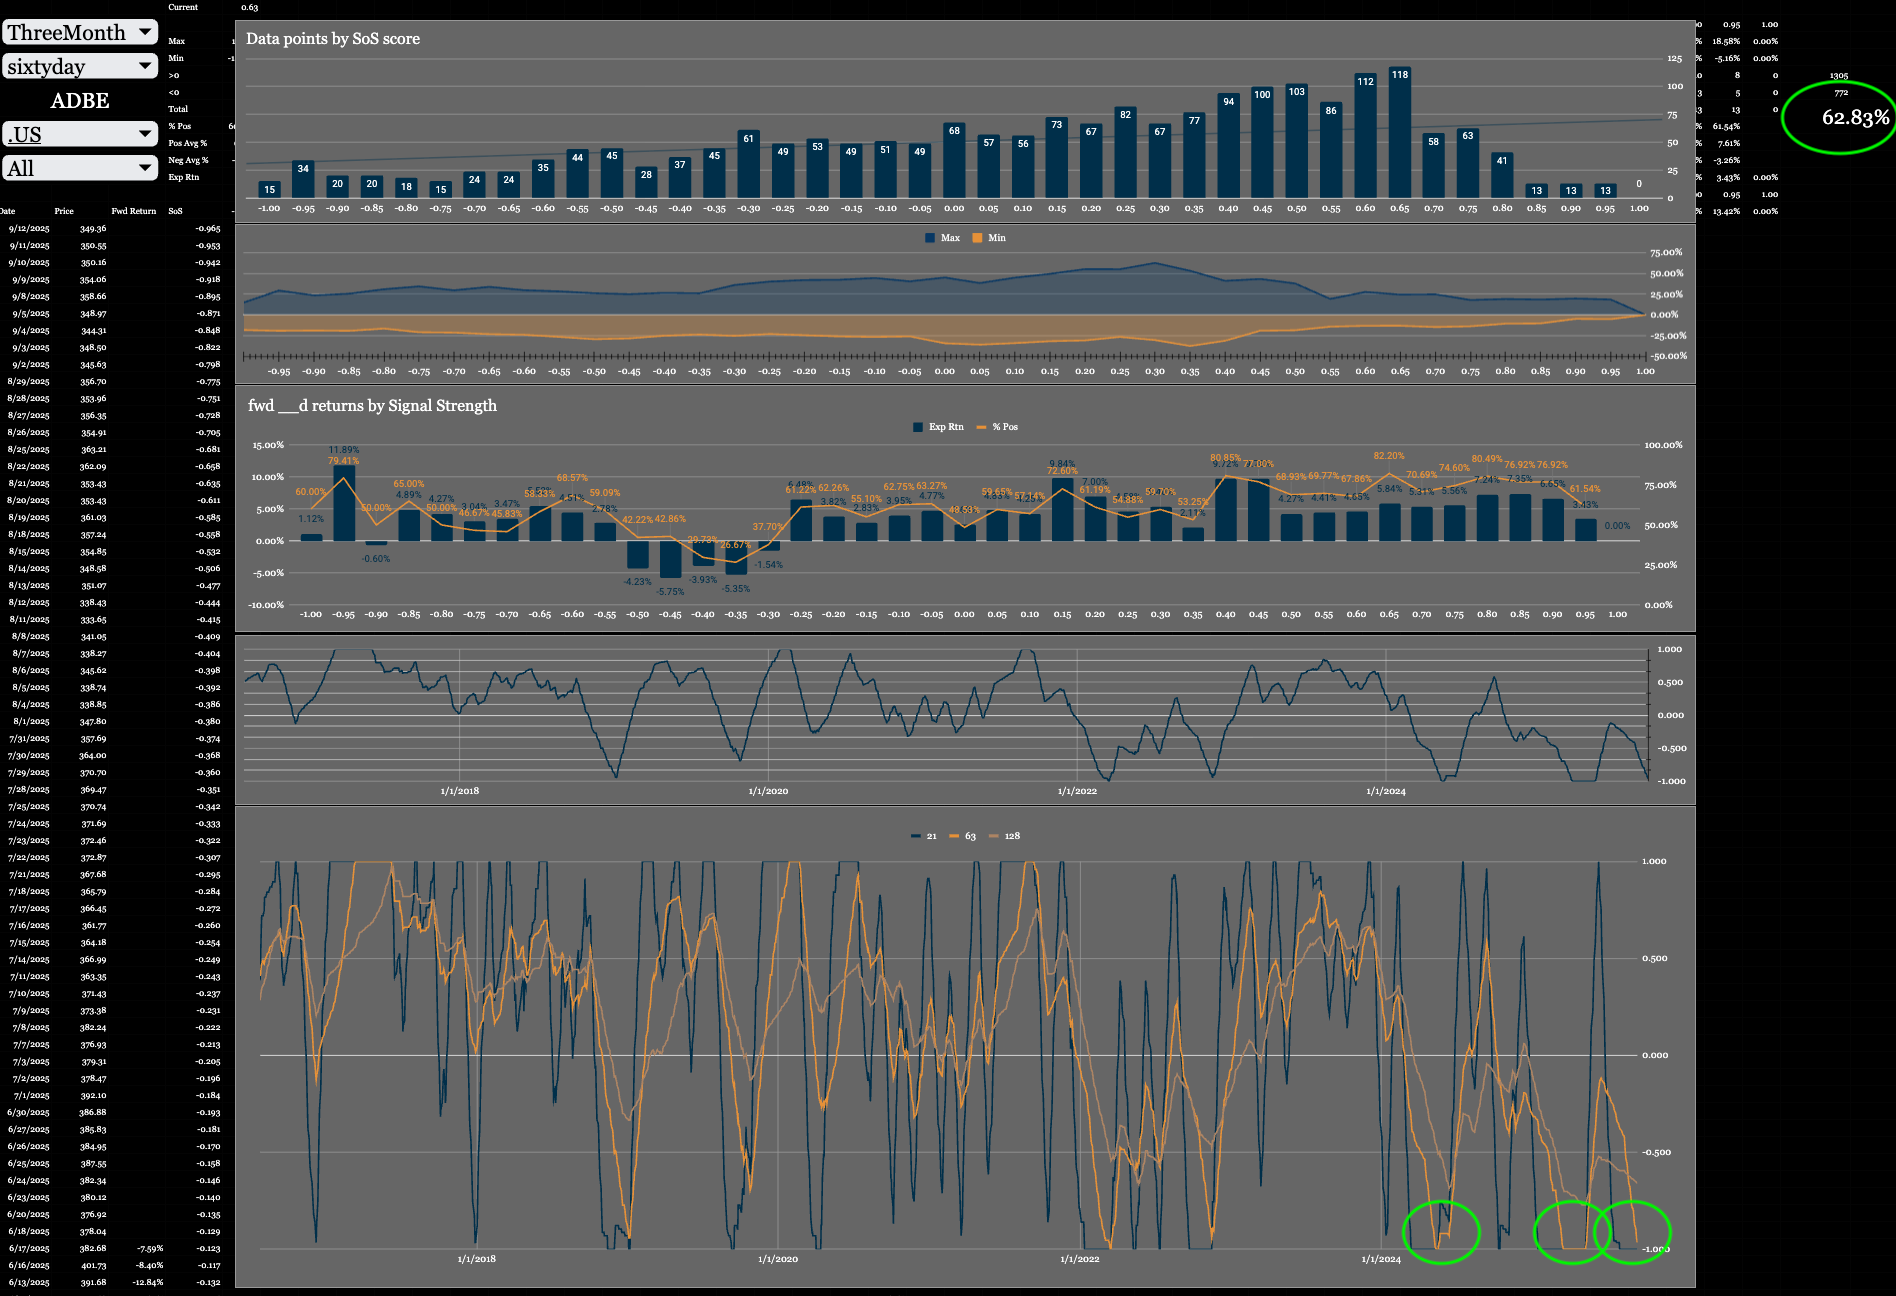
Top green circle teeny tiny number in the top right…
For the backtest window LULU spends 63% of its time trading above zero on those wiggly lines at the bottom.
Simply when it trends it trends higher.
Bottom green circle when my measure of signal strength is very low across all timeframes we have trigger_9b which is a short hand way to say some numbers got to some combination of values which in the past have been important.
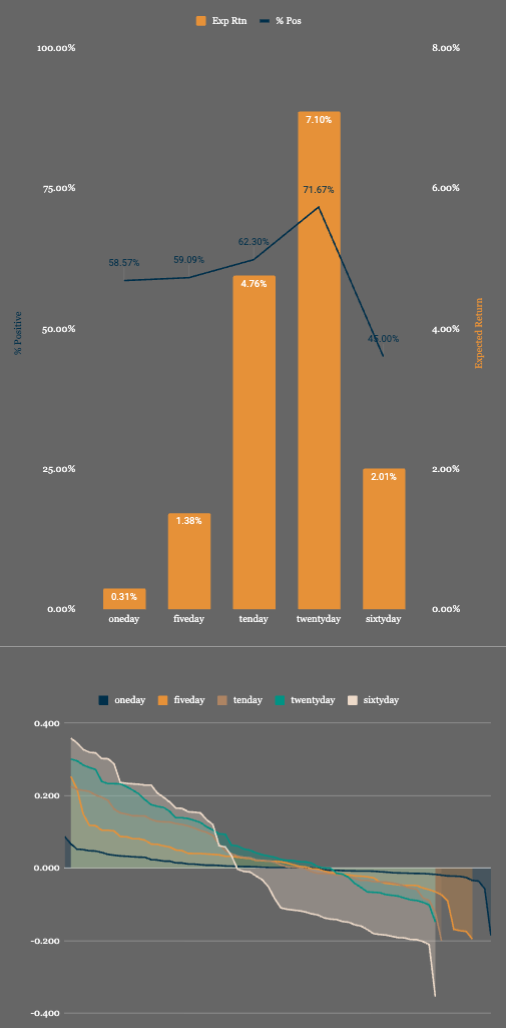
Greater than 10 days we have a ~60-70% chance of a positive return.
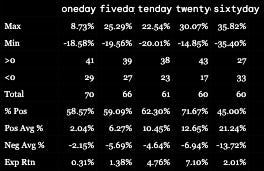
Looking at the max returns 20-35% might be on the cards.
Who knows!
Trigger_3 also “popped off” which is a options derived measure of selling pressure.
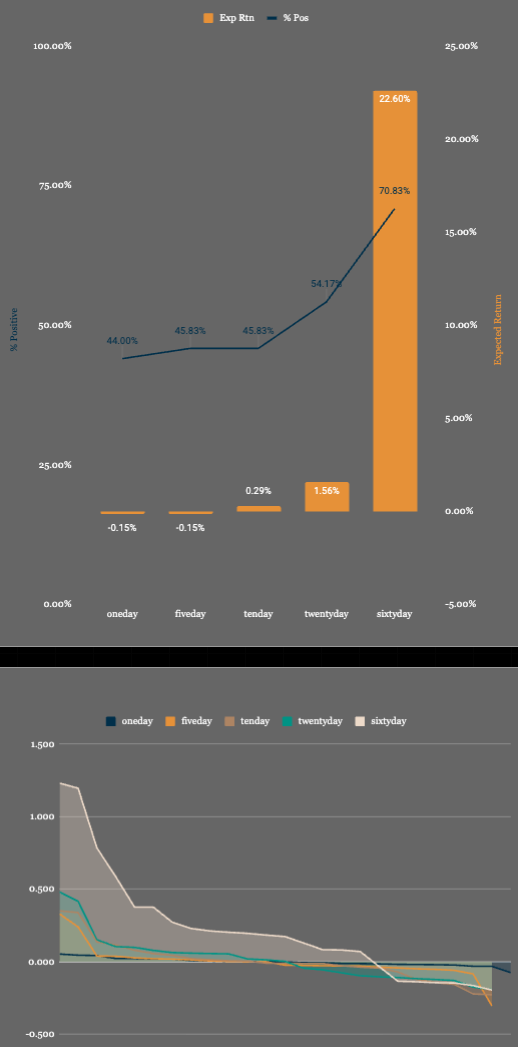
Fewer examples but a much more right tail skew!
All of this is to say make it small, the stock looks like shit and this is picking a bottom which is never easy.
A very small call option position that won’t hurt the 30% of the time it is wrong but could be big enough to make it a fun outcome.
If you need a “catalyst” or a read on the “fundies” you are in the wrong place, and I can’t be arsed to use chatGPT to pretend I know what I am talking about.


Here are some people that at least look like they know what they are talking about!
New user guide - Paid Portfolio Posts

Latest portfolio Update

Hot Takes with Hank

Think pieces!


Hey Chris! How do you decide when to get out of these positions? What's your trigger to take a profit and to stop a loss? Do you wait for momo and/or trend to break?