
KeepItSimpleSubstack
Week 22 - SP500 Update

I highly recommend using the link to view these posts in a desktop browser. Substack limits the size of emails, and since I use a lot of images, some readers have been missing important data by only viewing the truncated email
TL;DR
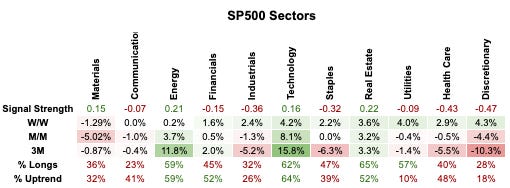
🛢️ Energy leading momentum but falling behind Tech
📲 Technology leading the pack on price but only 48% is bullish.
🛳️ Big jump week/week is it the end of the beatings?
⑦ Mag 7 wide dispersion between the names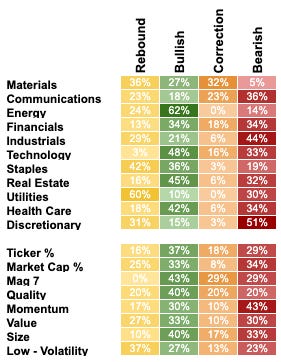
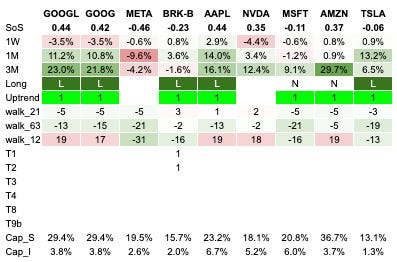
Here is a snapshot of part of the dashboard subscribers can access, there they can see every ticker in the SP500 index.
Strength of Signal (SoS) is our driving measure of strength and how we start to rank all the tickers.
Then we show price performance.
Long denotes if something is above our measure of trend which is not a moving average but something proprietary.
Uptrend shows if SoS is rising or not.
Walk forward shows us if the old prices in the look back are a tailwind or a headwind to our measures being positive.
Triggers (T) show multiple triggers both mean reversion or trend type triggers.
Cap_S shows the market cap weight within its sector.
Cap_I shows the market cap weight within the index.
Over the paywall I go more in-depth and paid subscribers can access grabs of the spreadsheets showing all 503 tickers in the SP500.
New user guide

SimpleSPYman

Hot Takes with Hank

Think pieces!


