

I highly recommend using the link to view these posts in a desktop browser. Substack limits the size of emails, and since I use a lot of images, some readers have been missing important data by only viewing the truncated email
TL;DR

🚰 Utilities Got the rally that we thought. Is it the start of a rotation or is it one of those dead felines?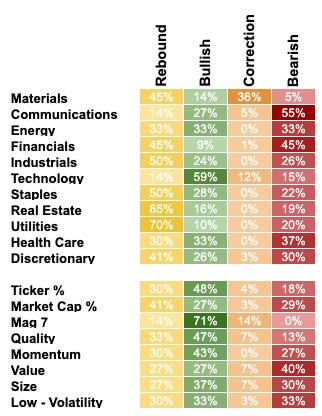
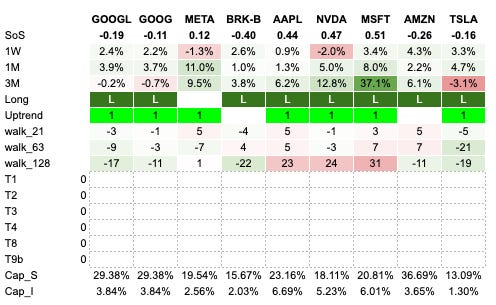
After all that time of lagging now the Mag 7 or whatever they are these days are leading…
This I hope highlights the breadth nonsense.
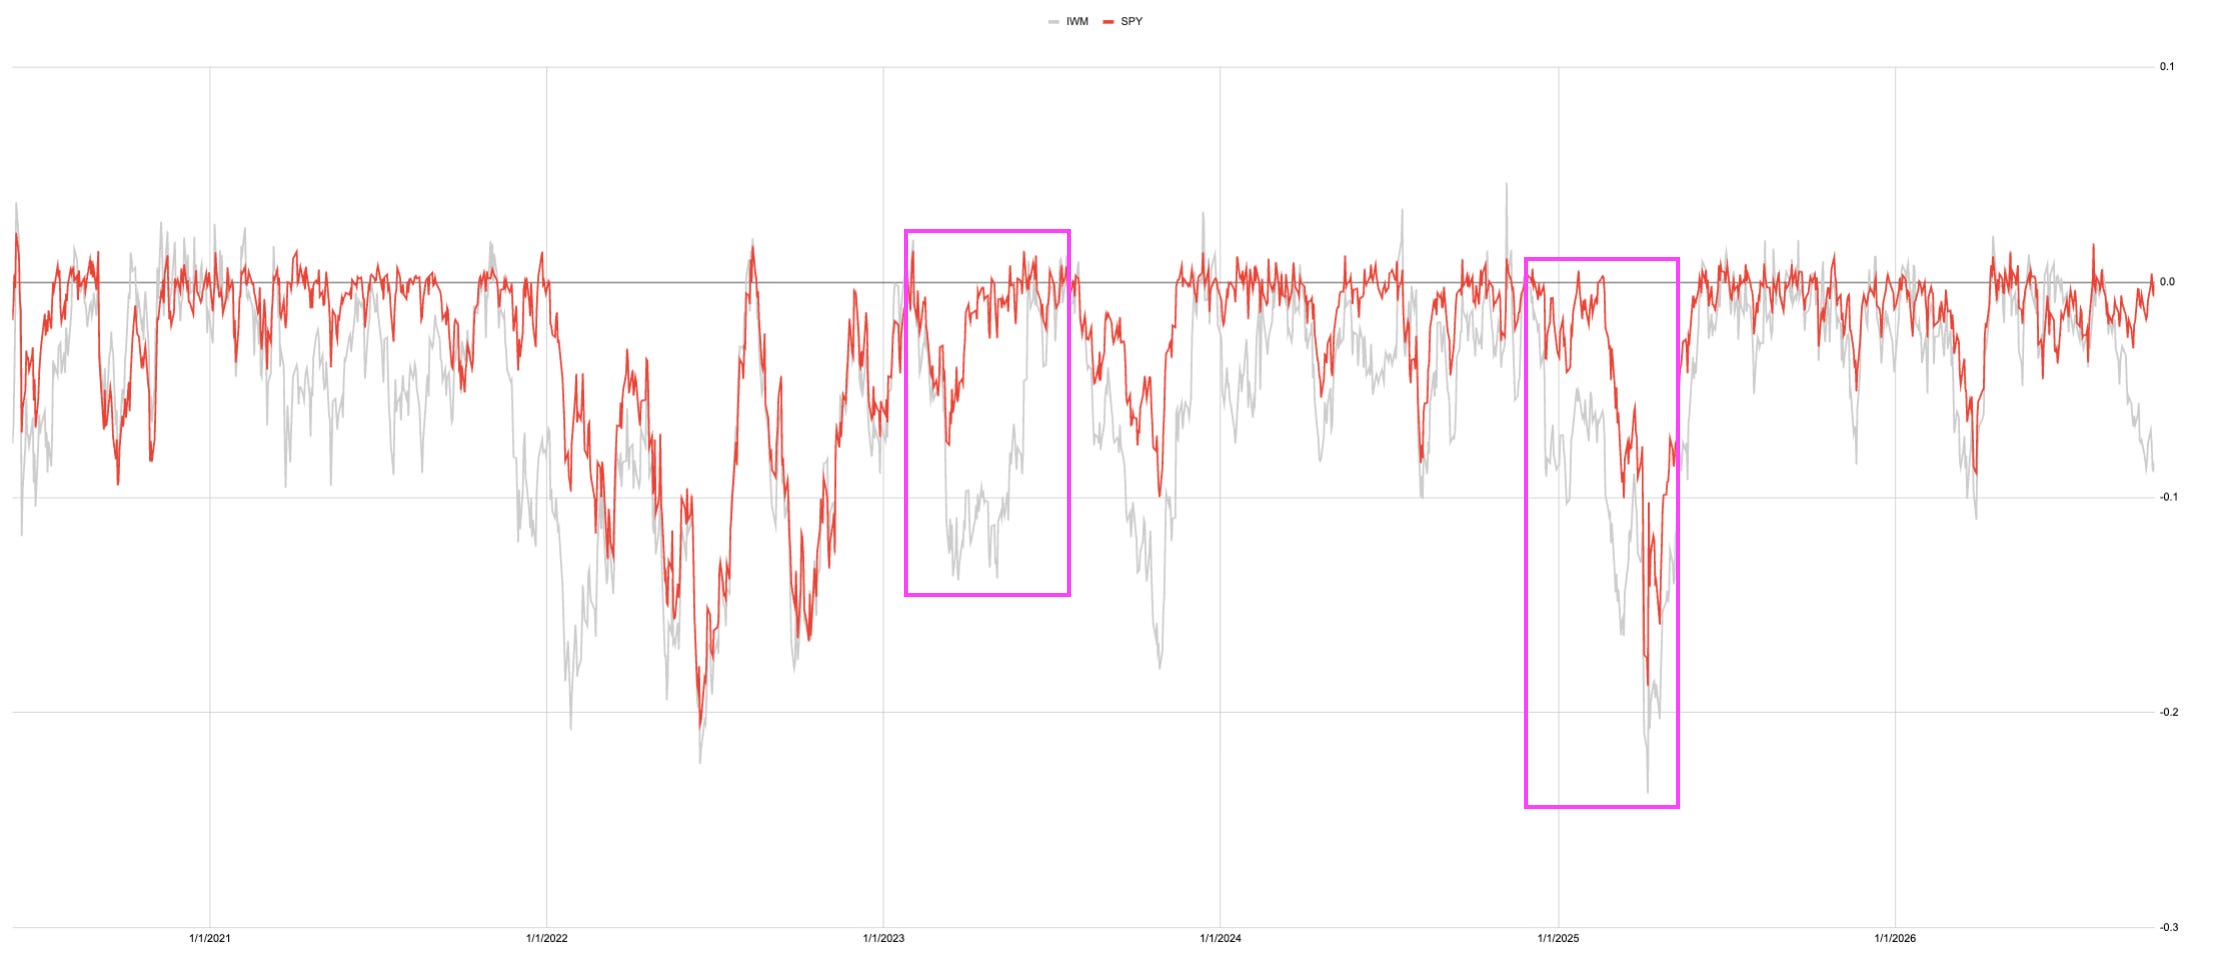
There are periods where the many diverge from the few, but which type?
Is it the type where the end of the under-performance actually drives the index higher to a crescendo?
Or is it the signal that the end is already here?
More for the paying peeps below ;)
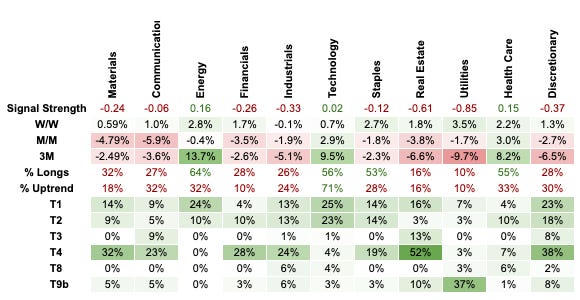
Utilities out performed the other sectors this week.
Tech and Health Care the only sectors positive over the timeframes that matter most.

The V bottom signal has worn off. How will this translate as we move forward was it the last roll of the dice, or will we see the crash higher into the new year?
New user guide

SimpleSPYman

Hot Takes with Hank

Think pieces!


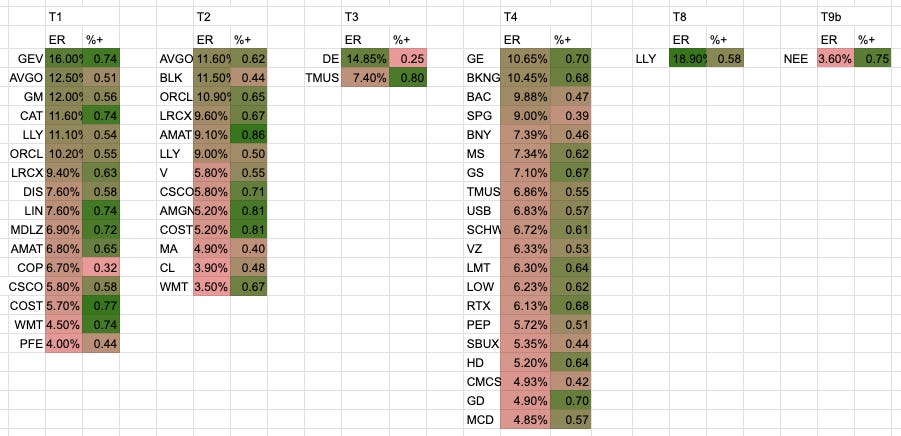
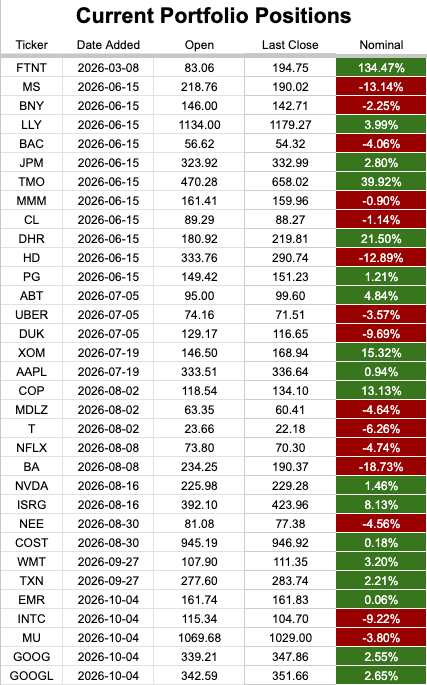
The main dashboards are all updated so you can see all 503 tickers in the SP500. Below I have included triggers and expected returns just from the top 100 we are now selecting from.



Have a great week everyone! Try not to listen to too much (any) silly news.
Dashboard ← Use this link to view the SP500 tickers dashboard.
1M/3M MOMO ← Use this link to find the stock’s positions relative to 1M + 3M momentum.
Signal Strength Dots ← Tracking all tickers in their SoS cycle.
Sub-Sector Signal Strength ←Sub-Sector SoS value chart