
Index plus Nothing for the Win!
Week 33 - Equity Portfolio Update

I highly recommend using the link to view these posts in a desktop browser. Substack limits the size of emails, and since I use a lot of images, some readers have been missing important data by only viewing the truncated email.
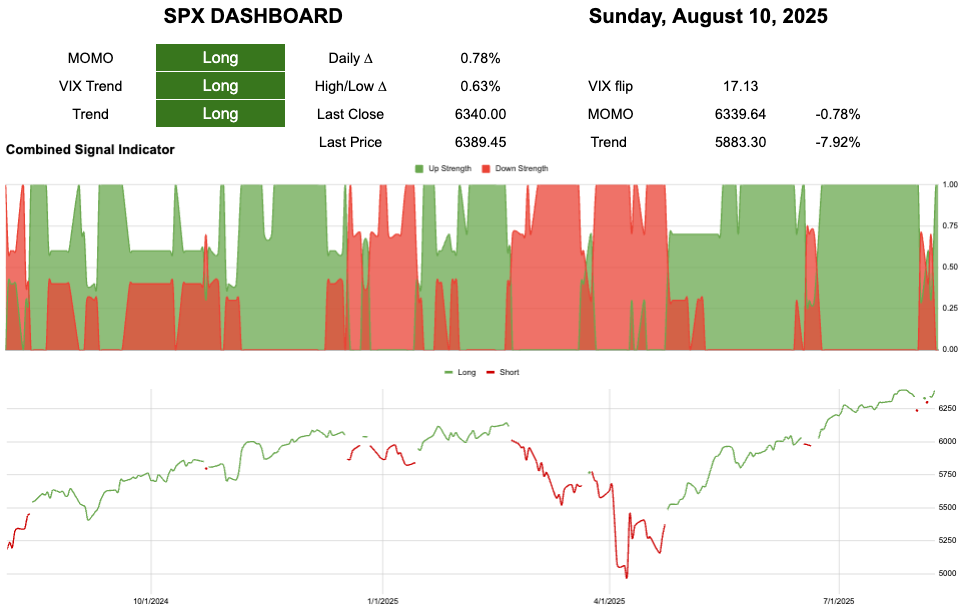
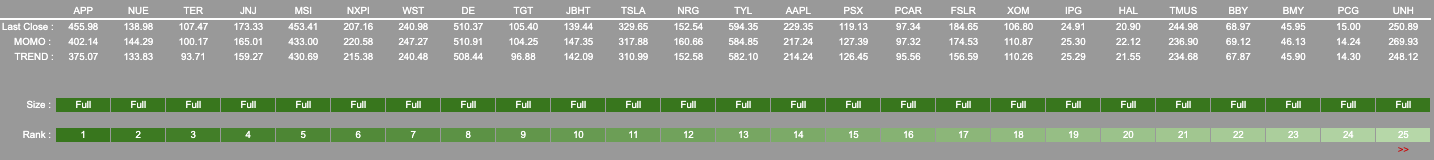
All green on the board again after a short term wiggle.
6339 to break momentum
5883 to break trend
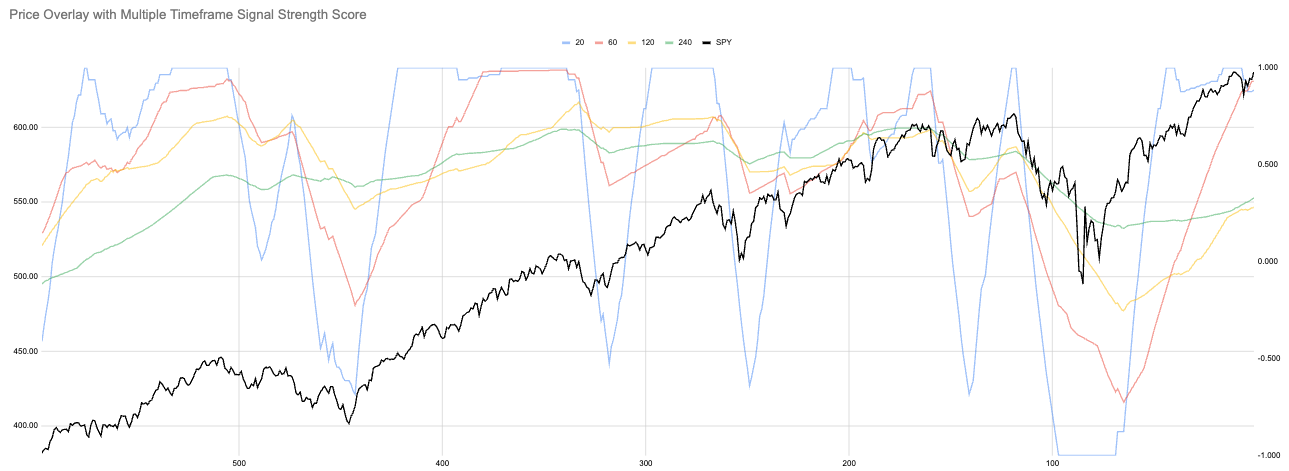
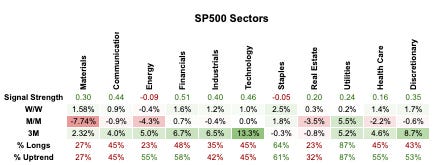
All Strength of Signal (SoS) are rising.
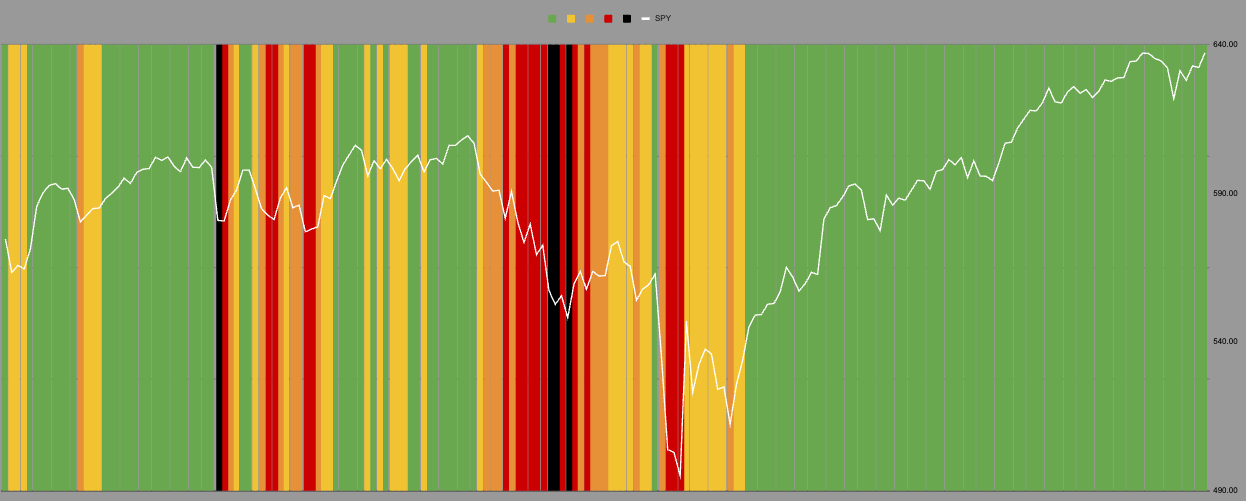
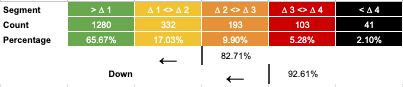
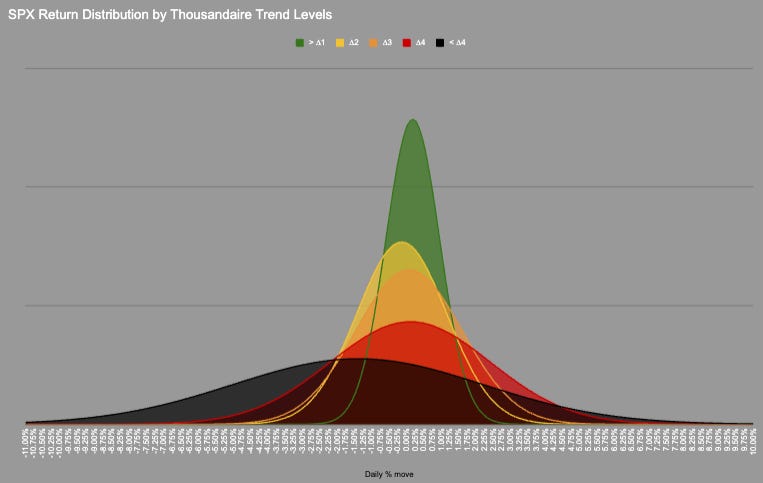
We remain in the green zone where SPX spends 65% of its trading time. This zone has a narrow but positively skewed distribution.
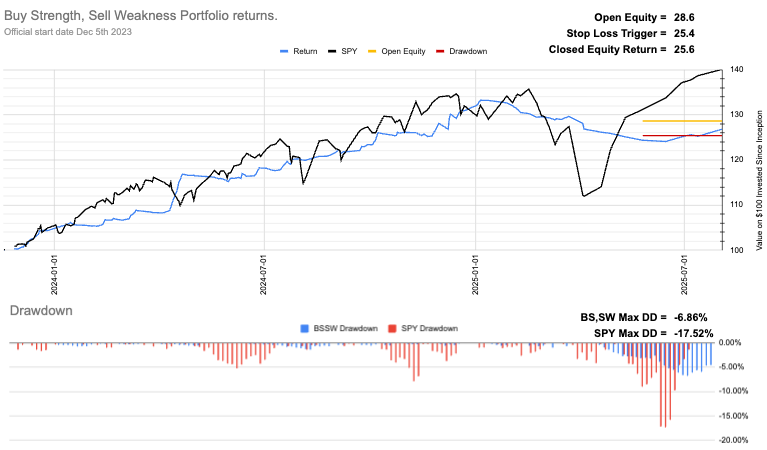
Current Open Equity = 28.6%
Stop Loss Trigger = 25.4%
Current Closed Equity Return = 25.6%
Our open equity outstanding is ~29% since we started in Dec ‘23. We have been able to capture ~26% returns in closed trades, meaning ~3% open equity still belongs to Mr Market. Until we close the trade it doesn’t yet belong to us!
Subscribe to see the portfolio. You can do it for free using the 7-day trial if you want.
New user guide - Paid Portfolio Posts

Hot Takes with Hank

Think pieces!


TL;DR
Corrections are out in force. Will the short term leak into the long term?
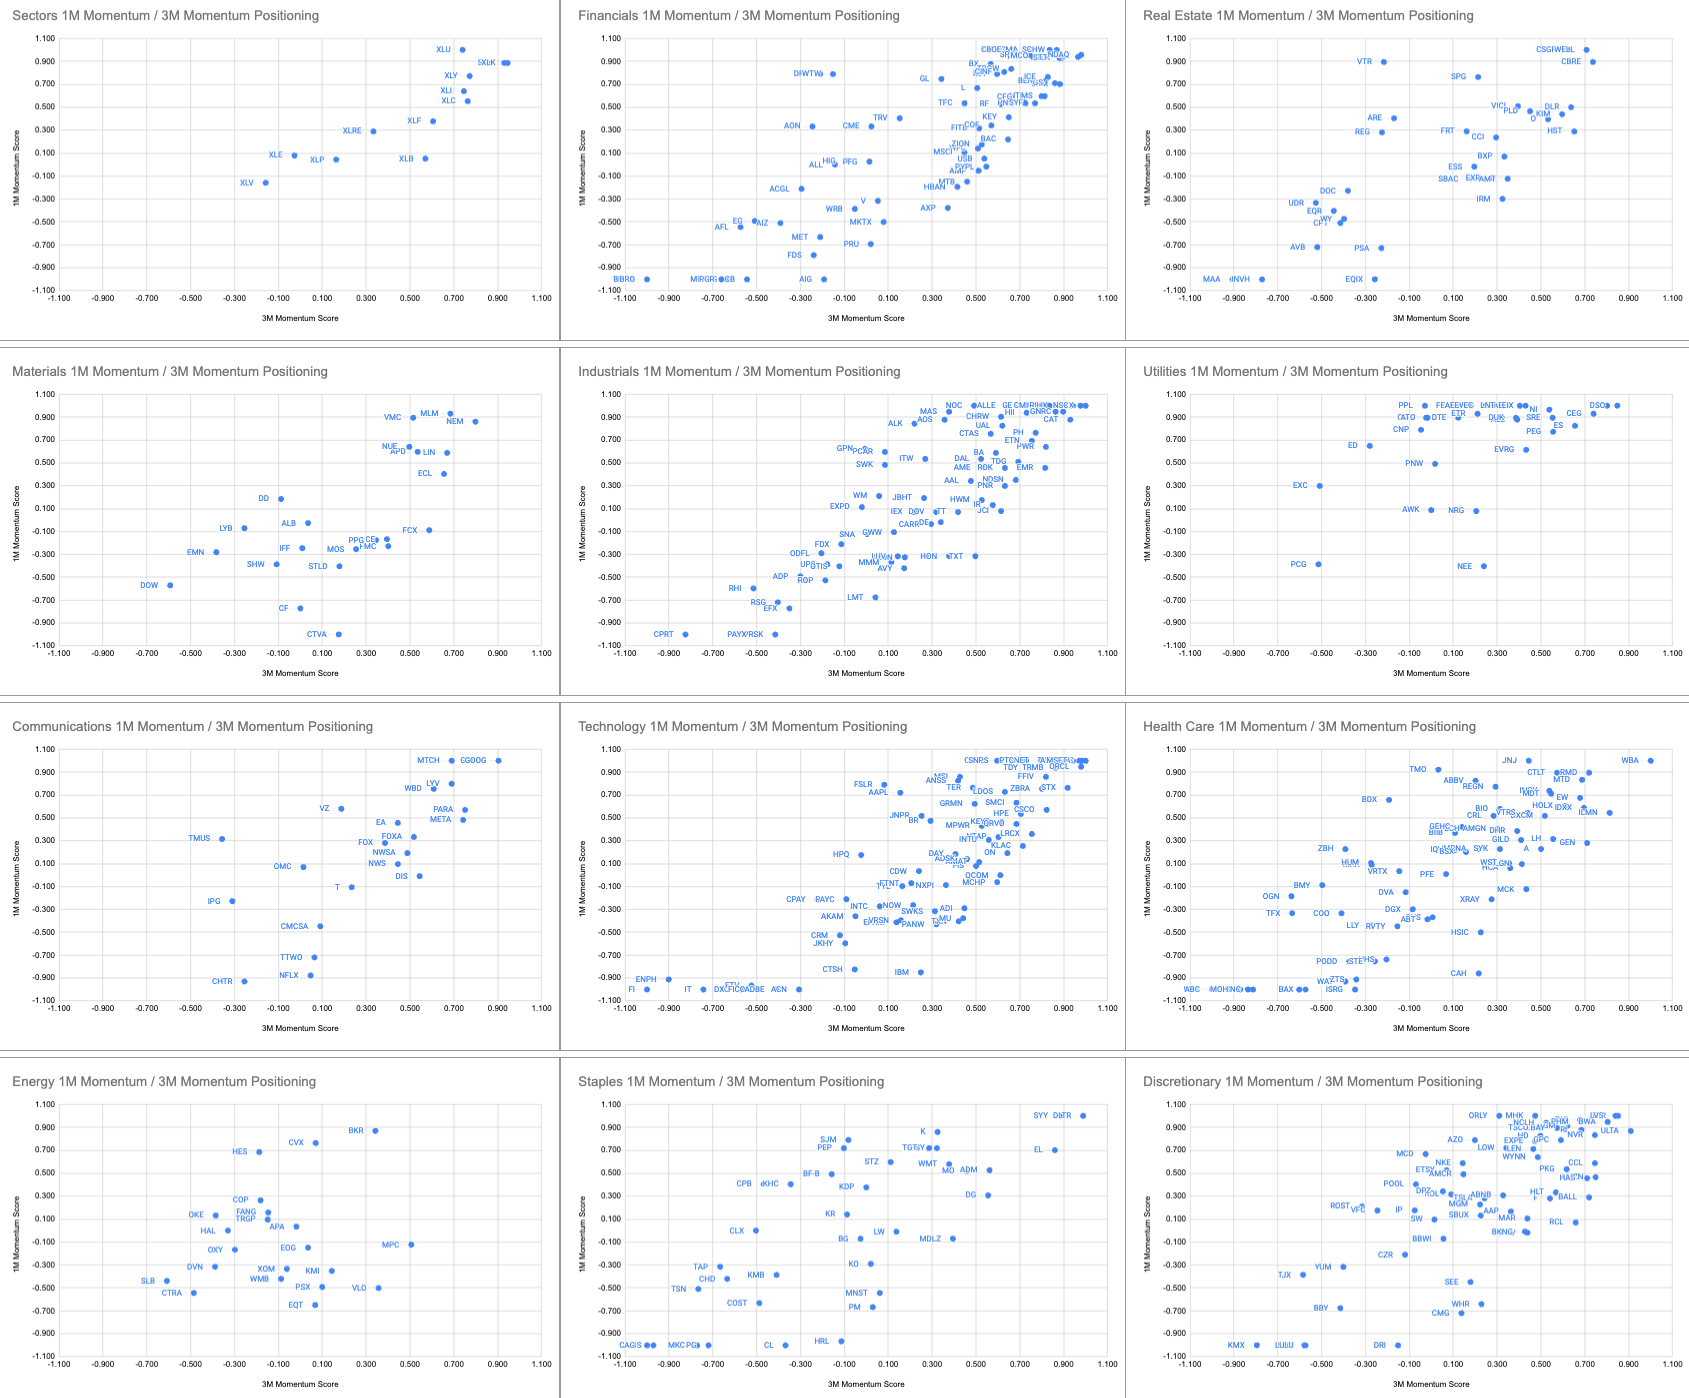
➐ MAG 7 MoMo and Chill
💡 Utilities Chose violence.
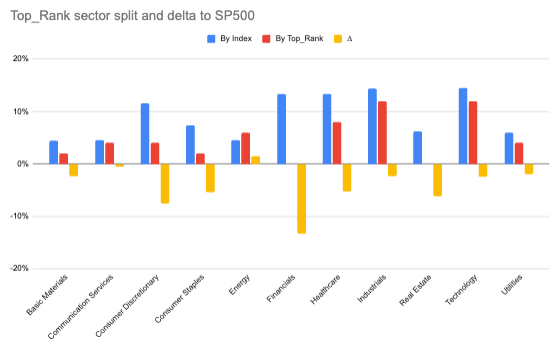
🏗️ Industrials breaking bad?
After the fastest recovery on record a bit of consolidation is to be expected. I highlighted in HTwH this week the view that we could see a similar move to Jan 2024 after the Halloween recovery. That was a period of “this market cannot survive only on strength from the MAG7”
Who knows?
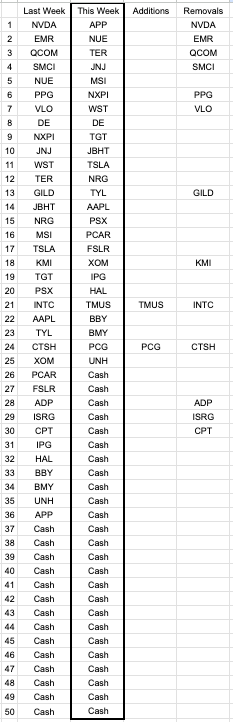
Remove   : NVDA EMR QCOM SMCI PPG VLO GILD KMI INTC CTSH ADP ISRG CPT

Addition : TMUS PCG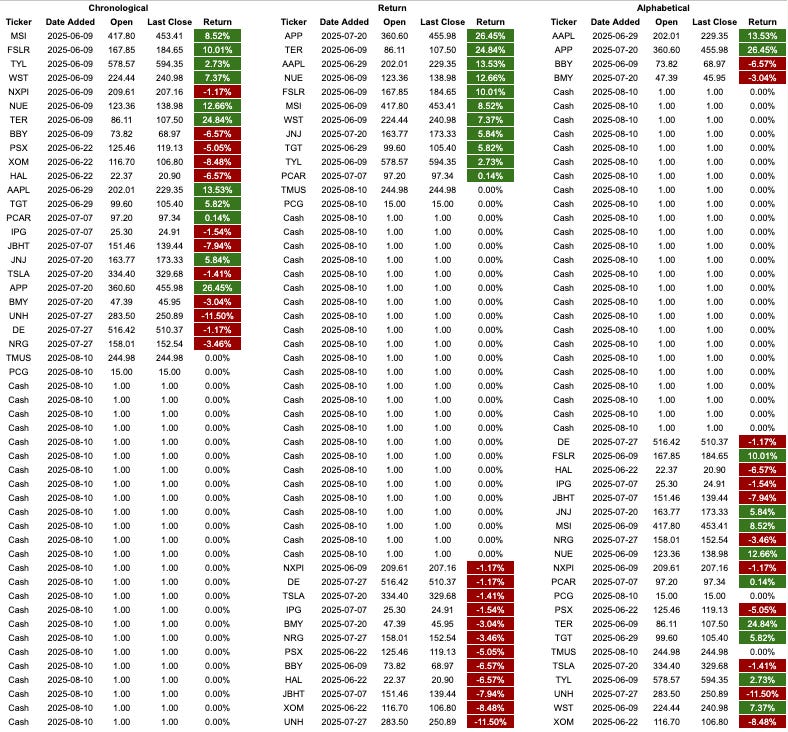
Have a great week, everyone. As always, if there are big moves intra-week I will post updates.
If you have questions please ask. Also, if you want me to cover something in next week’s HTwH post them here.
Dashboard ← Use this link to view the SP500 tickers dashboard.
1M/3M MOMO ← Use this link to find the stock’s positions relative to 1M + 3M momentum.
Signal Strength Dots ← Tracking all tickers in their SoS cycle.
Sub-Sector Signal Strength ←Sub-Sector SoS value chart
Wow! 52% cash and less $NVDA. Let’s get spicy. 🌶️