
Hello There! KeepItSimpleSubstack
Week 11 - SP500 Update

I highly recommend using the link to view these posts in a desktop browser. Substack limits the size of emails, and since I use a lot of images, some readers have been missing important data by only viewing the truncated email.
Everyone will automatically look at the red below but just take a little squidgy at the yellow. There are more than enough podcasts substacks etc talking about the red.
TL;DR
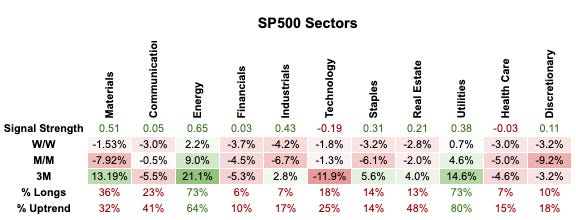
🚰 Utilities and 🛢️Energy holding up the best.
🏠 Real Estate and 🚜 Materials still in correction mode.
📲 Technology hello there...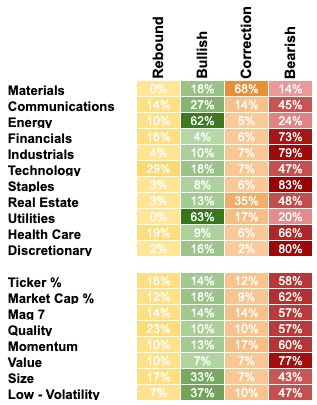

How ironic for the next leg of the market to be led by what it is almost always led by..
Who knew…?
Are we seeing the same volatility dynamic playing out in oil as it has in gold?
Price up / Vol up drives two things. One is that the price can be driven further by options. Two systematic trend followers who may be long oil because their spreadsheet told them to be and not some macro bro. Depending on their strategy as volatility rises they also have to reduce their position size. This leaves an air pocket and a lack of buyers.
Remember 401k contributions and target date funds are not buying WTI futures contracts every payday like they do AMZN or NVDA et al.
Over the paywall I go more in-depth and paid subscribers can access grabs of the spreadsheets showing all 503 tickers in the SP500.
New user guide - Paid Portfolio Posts

Hot Takes with Hank

Think pieces!

Stuff and things have happened. Last week we captured 5% returns by making sales and raising cash. This week we are down -2.67% vs -1.8% for the index.
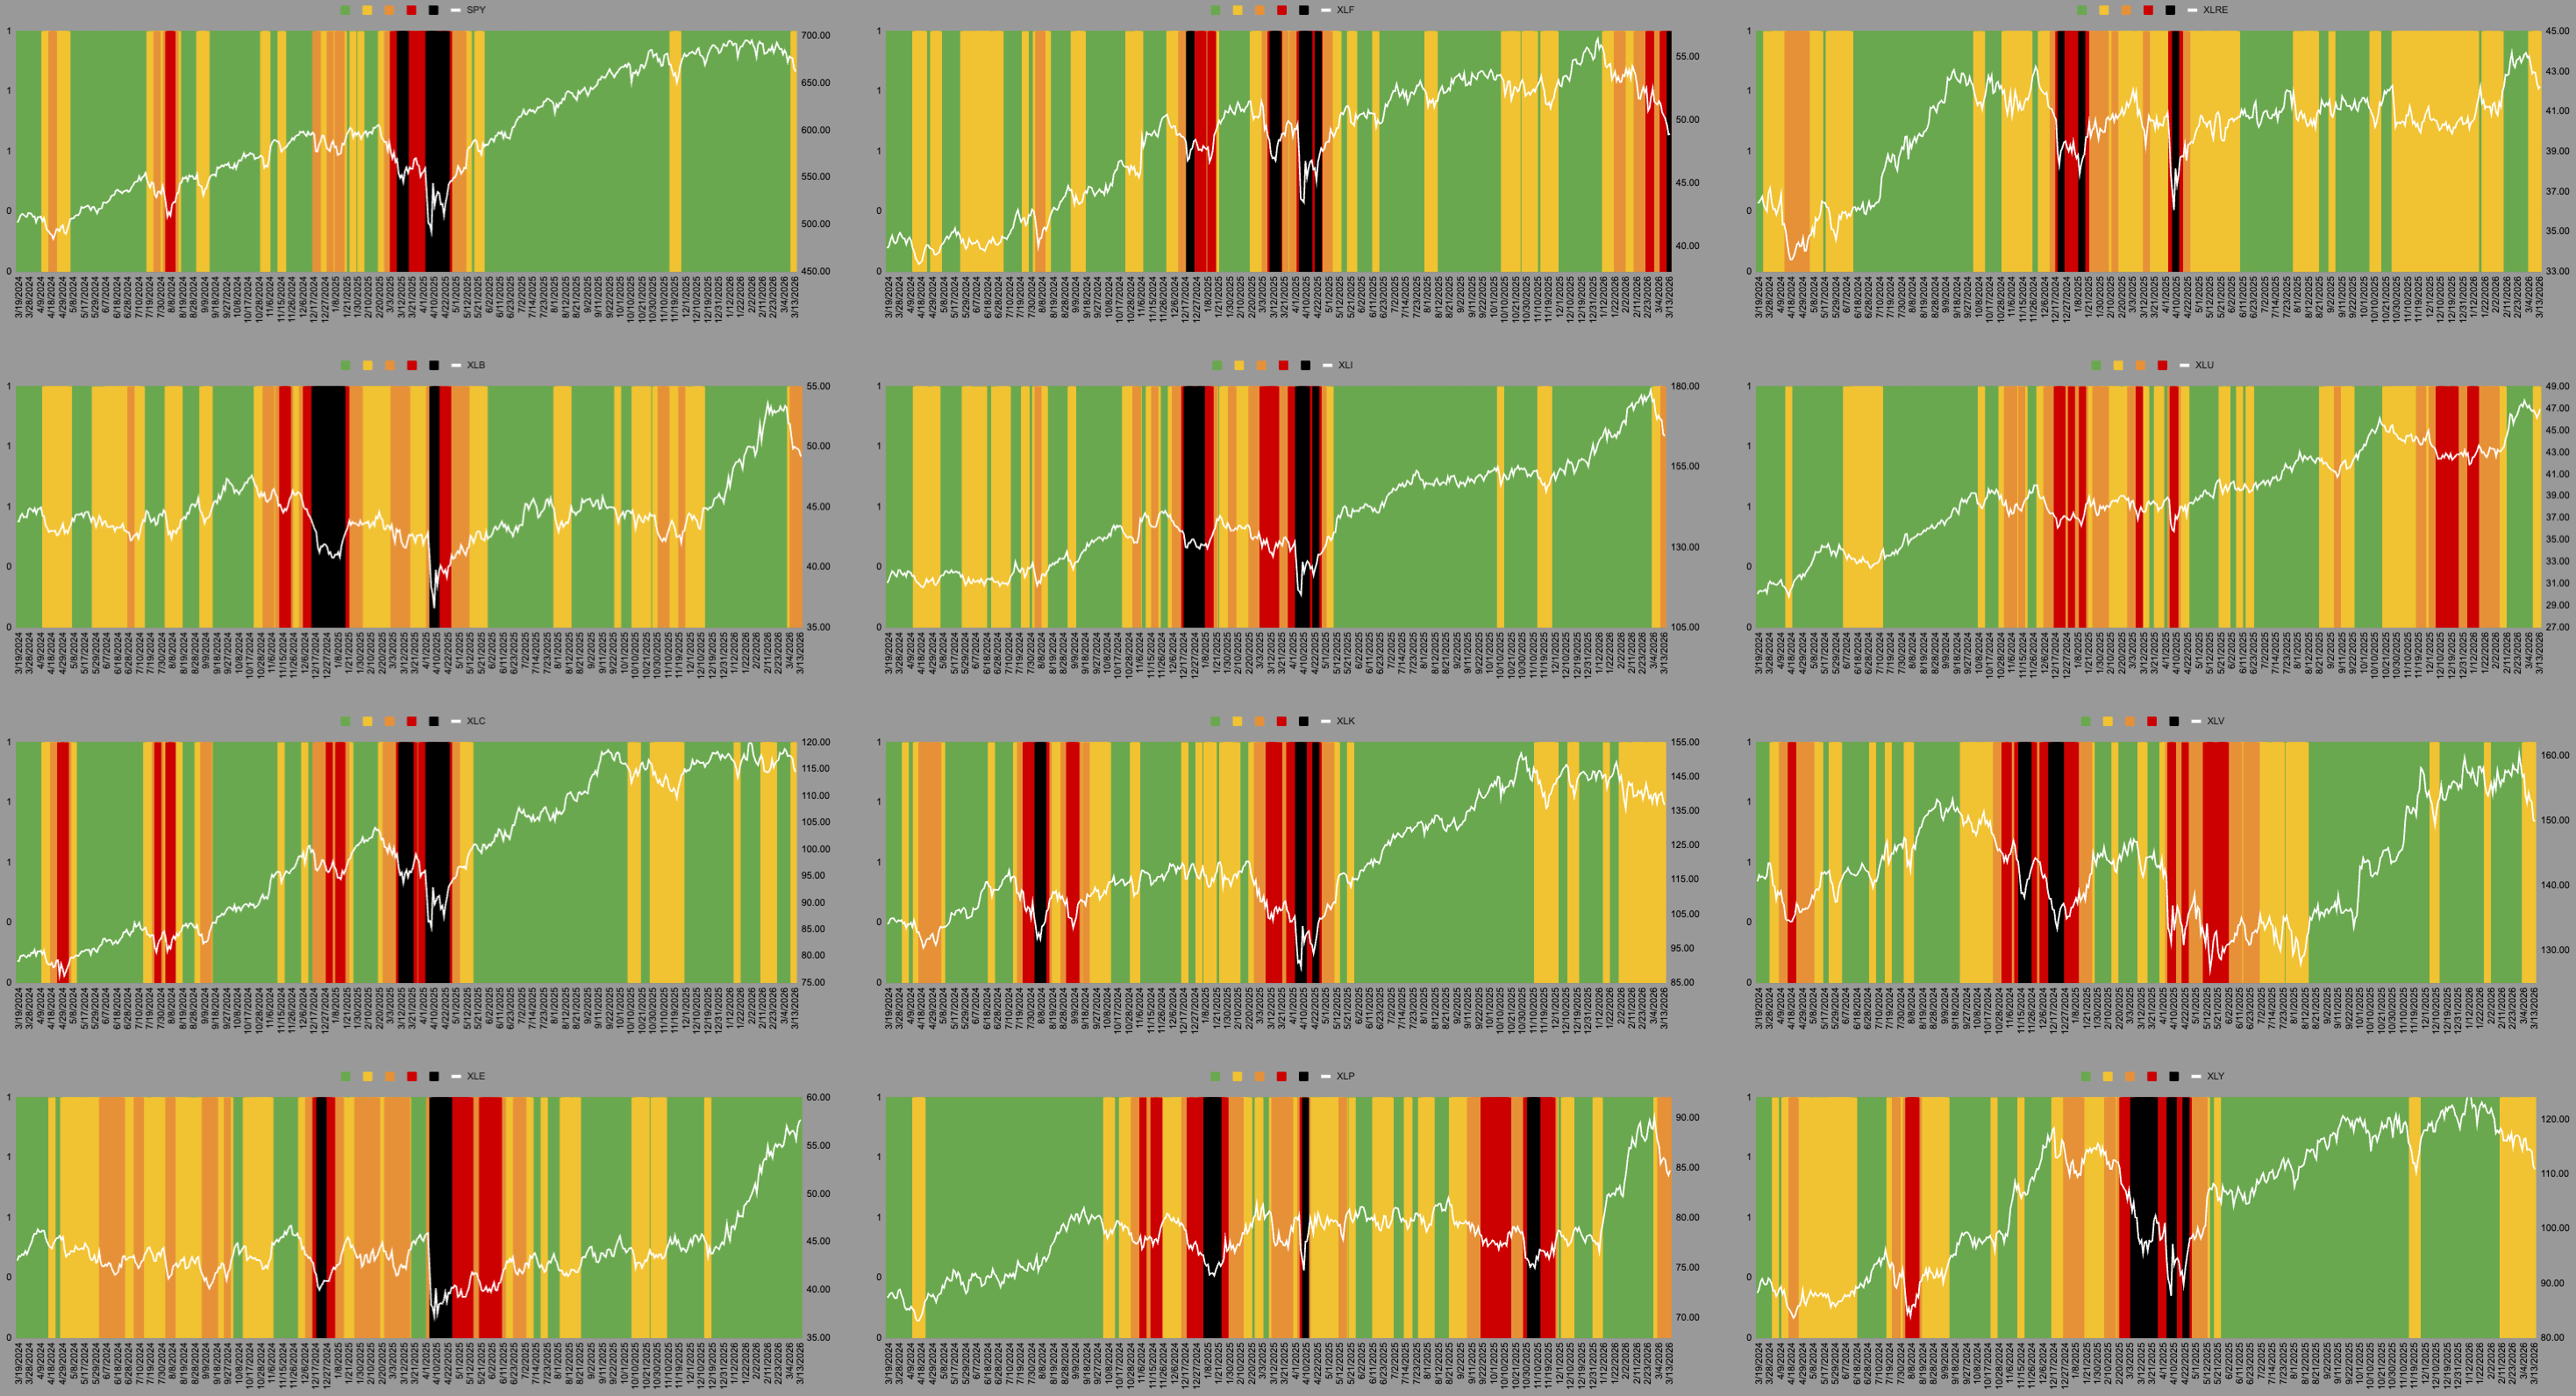
Anyone remember when Health Care was laying on the floor bleeding and all the bros were sticking the boot in just in time for the index to go up 25% and parts of the sector up 50-100%. That lined up with the black line of doom.
Well now it is Financials. Have you gone this week without reading or hearing about private equity/credit blowing up?
Tech which already ticked higher after I posted about IGV. Financials and Discretionary are 3 of the 4 largest constituents of the SP500.
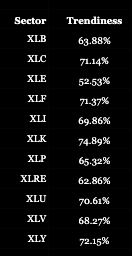
Technology, Discretionary and Financials are also the highest in “trendiness” of all the sectors.
Last week for Technology and this week for Financials and Discretionary saw the largest grouping of buy signals for those of you that play the options game.
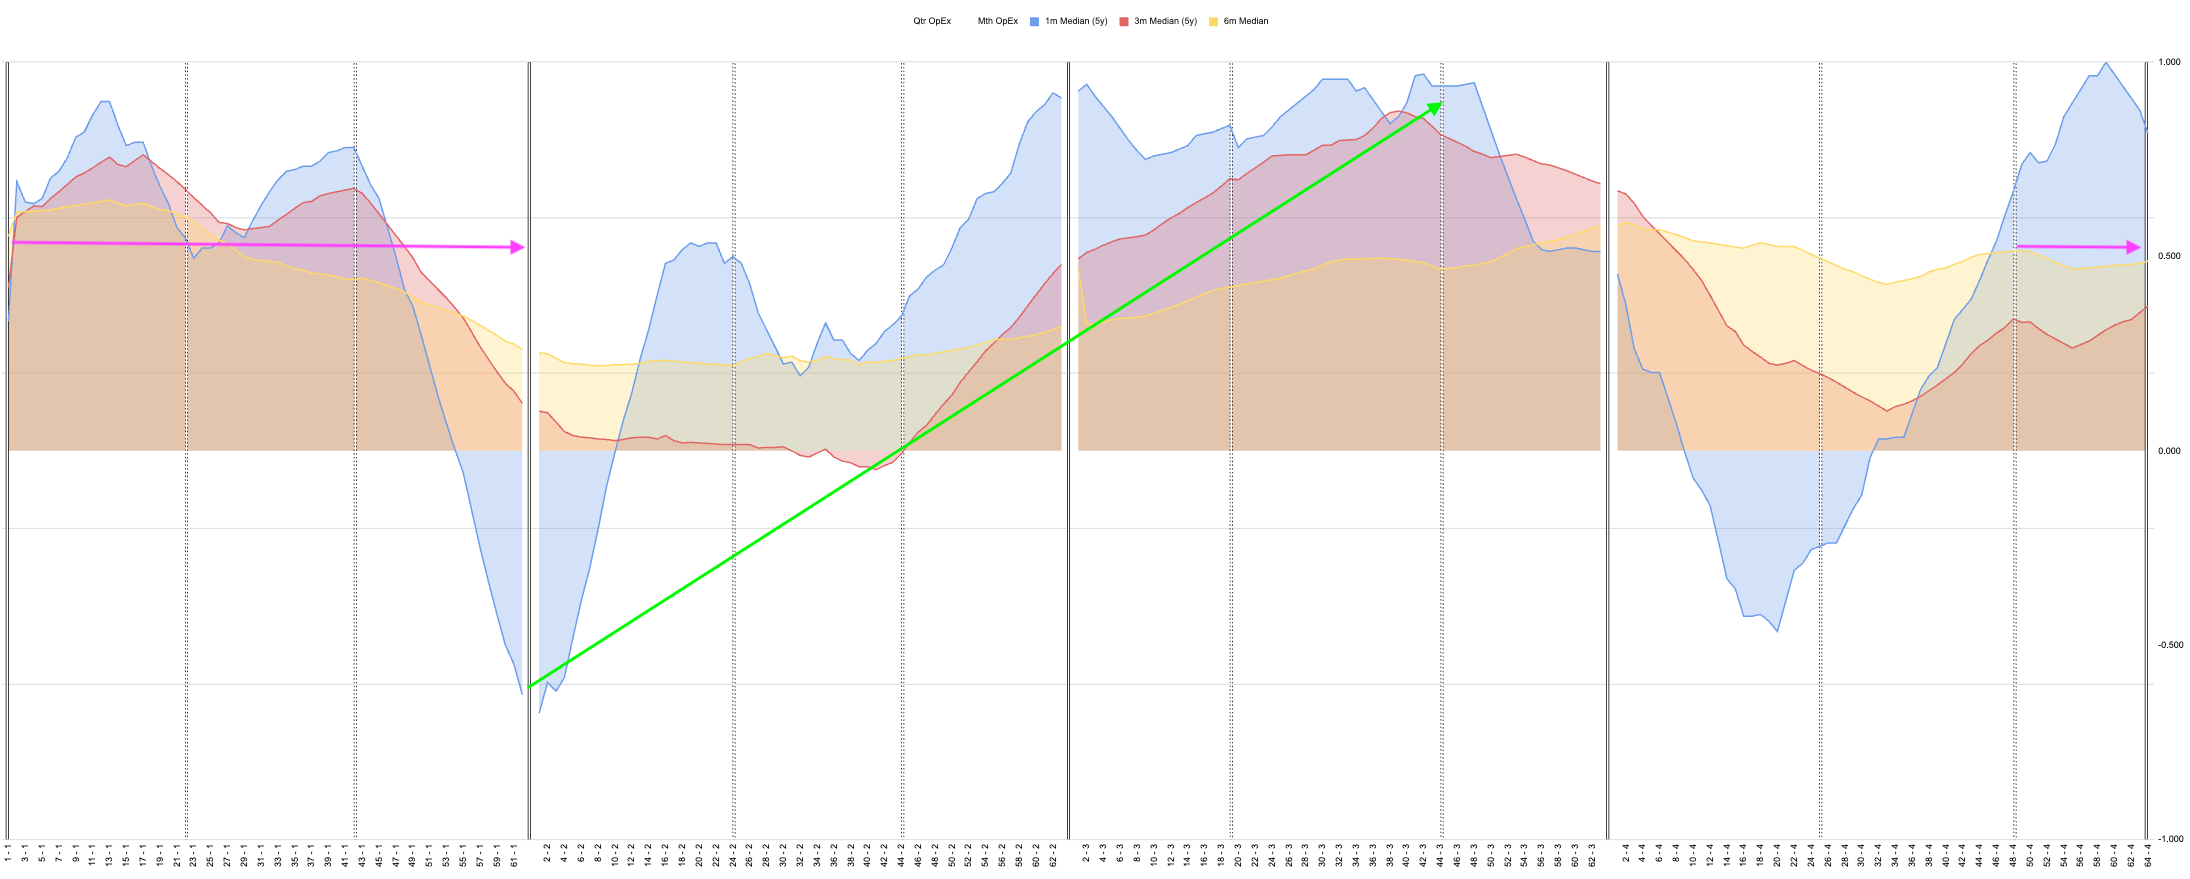
Which also coincides with the chart that poopoo’s on the nonsense “sell in May and go away”
Which lines up with I think we are going into year 2 of my 2 year cycle.
Is this simple or not?
Does this make sense?
Please be honest I want to help as many people as possible. If it doesn’t make sense then there is no point in writing this every week.
If you have questions please ask in the comments or in the chat.
Dashboard ← Use this link to view the SP500 tickers dashboard.
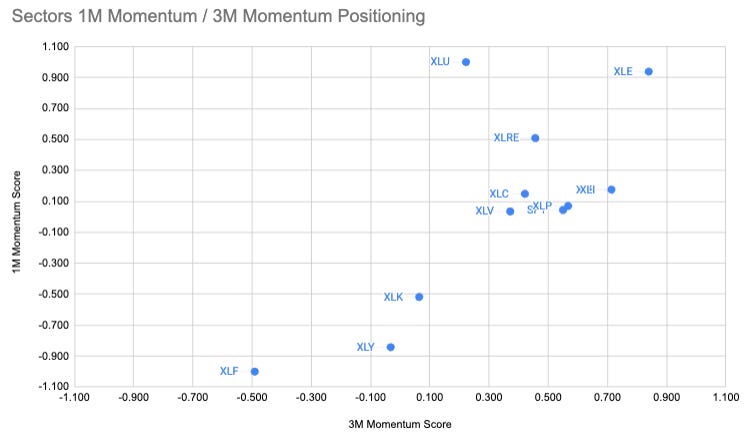
1M/3M MOMO ← Use this link to find the stock’s positions relative to 1M + 3M momentum.
Signal Strength Dots ← Tracking all tickers in their SoS cycle.
Sub-Sector Signal Strength ←Sub-Sector SoS value chart