
FREE ACCESS Portfolio Update is open to all this week! Last Chance!
Week 31 - Equity Portfolio Update

I highly recommend using the link to view these posts in a desktop browser. Substack limits the size of emails, and since I use a lot of images, some readers have been missing important data by only viewing the truncated email.
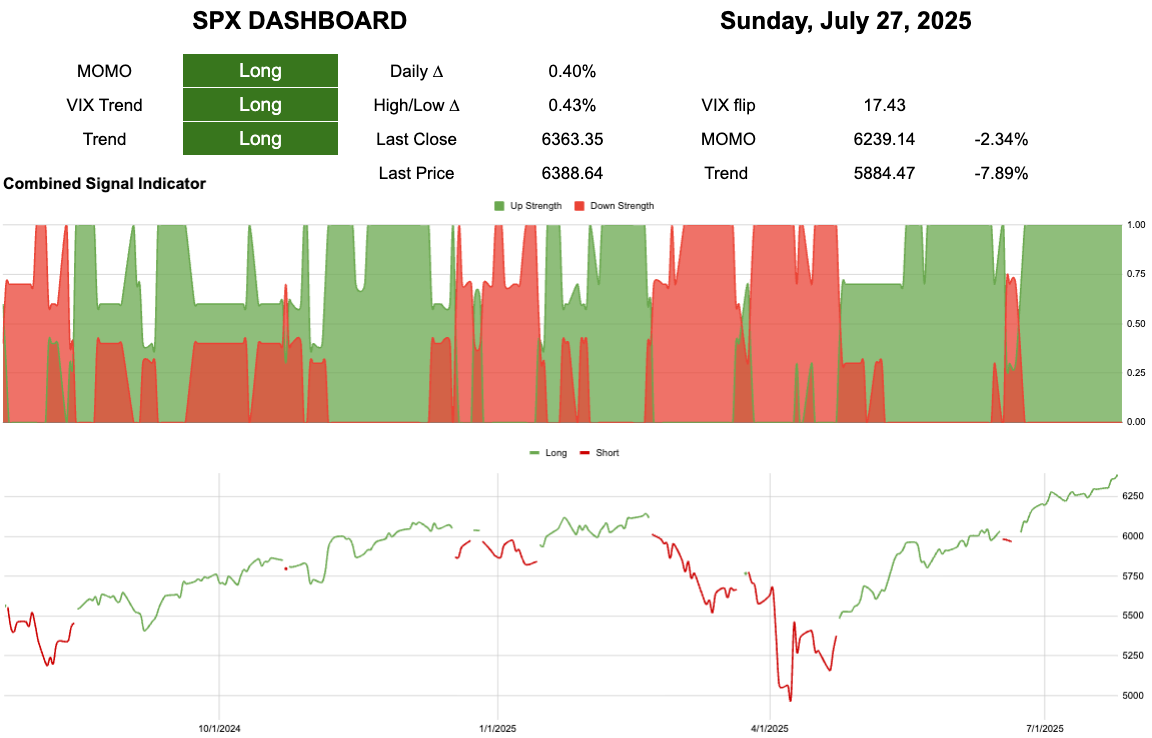
All green on the board.
6239 to break momentum
5884 to break trend
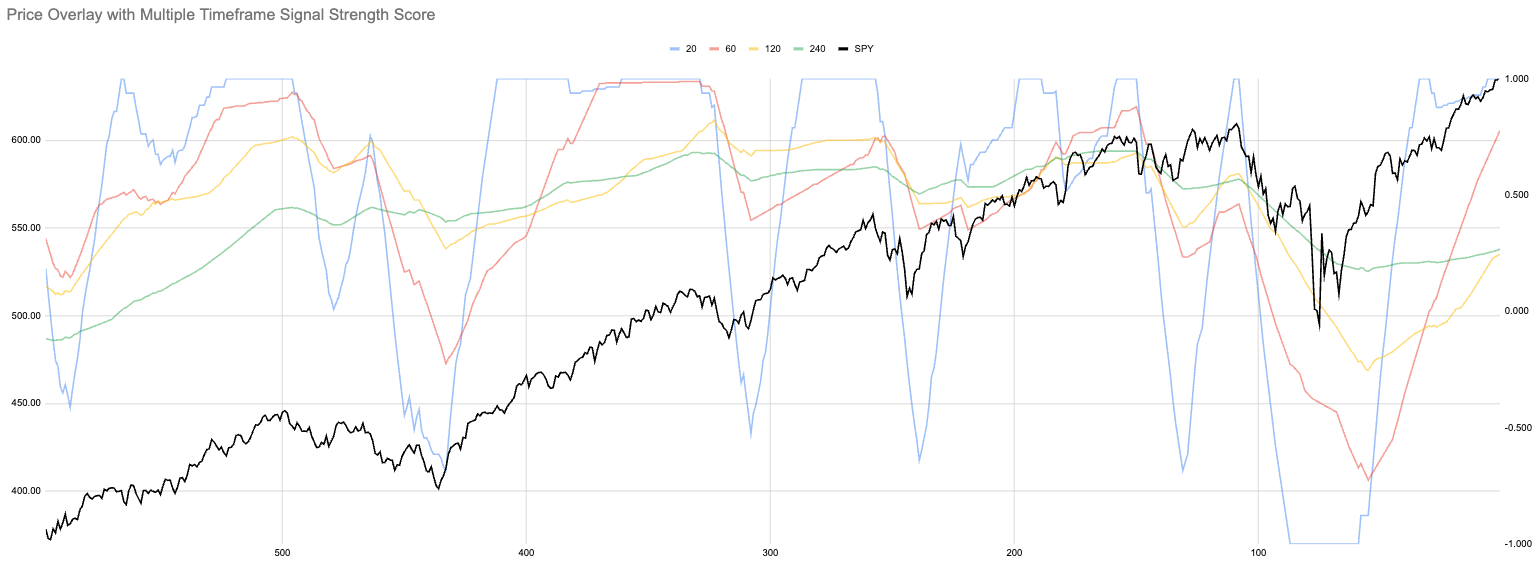
All Strength of Signal (SoS) are rising.
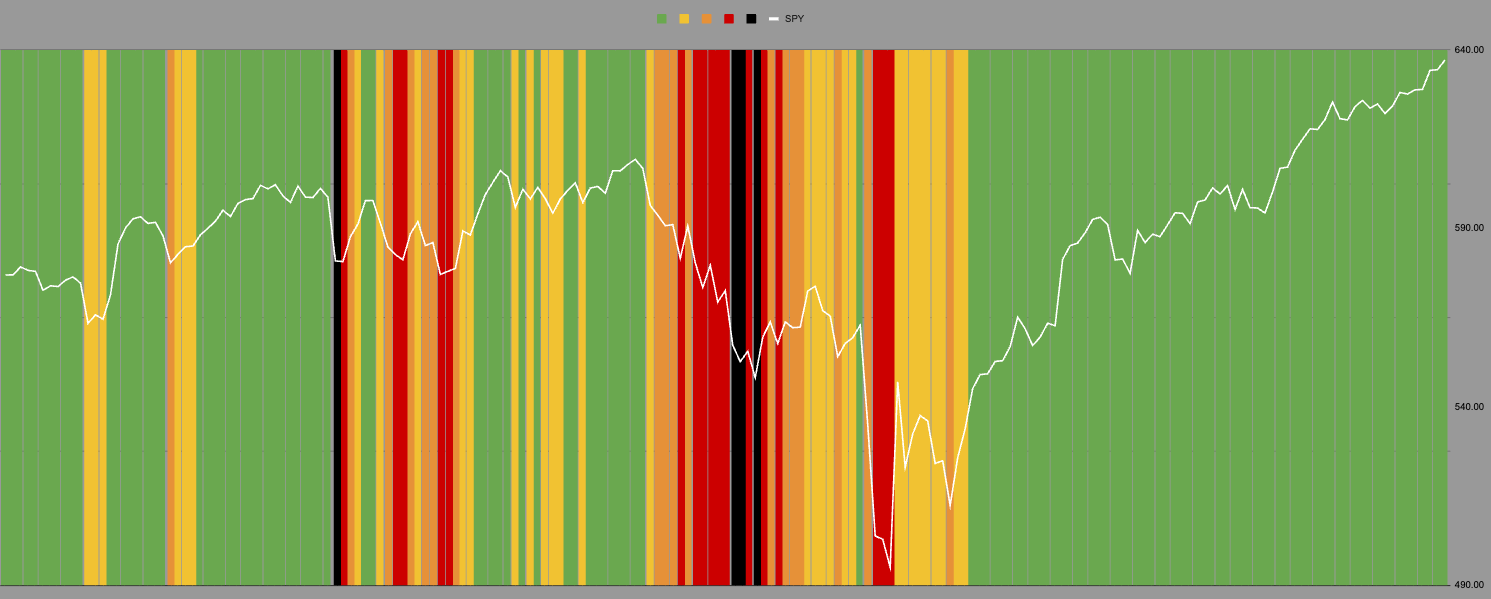
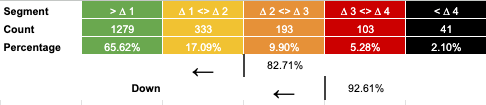
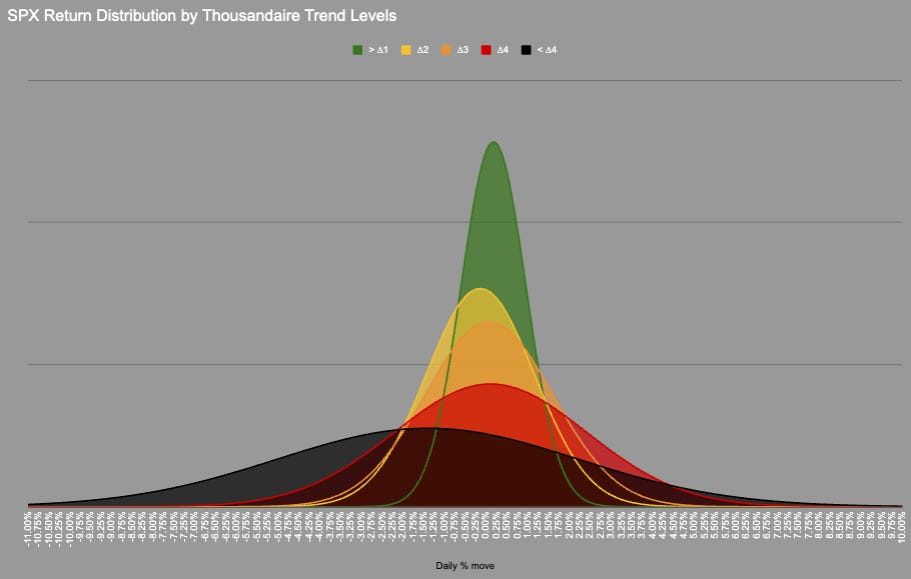
We remain in the green zone where SPX spends 65% of its trading time. This zone has a narrow but positively skewed distribution.
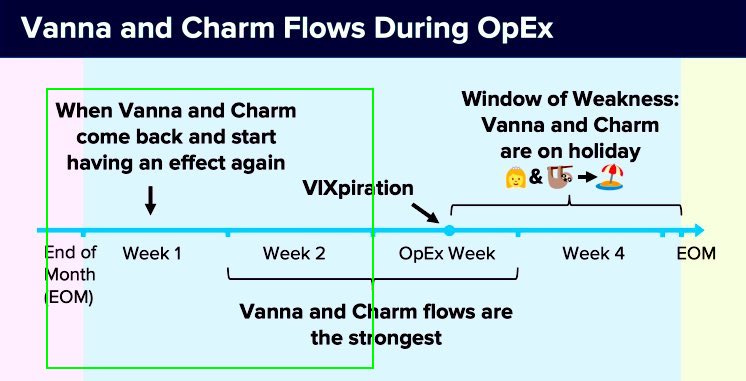
Vanna and Charm returning this week?
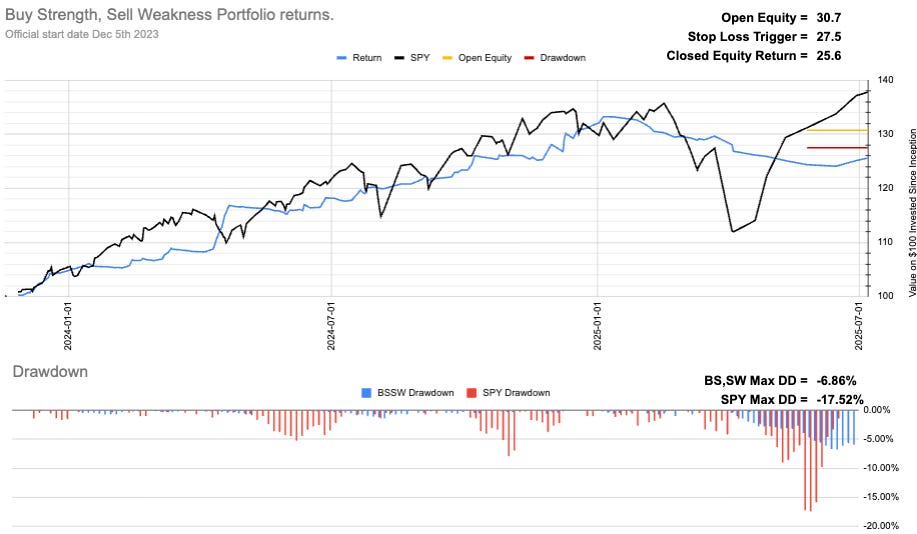
Current Open Equity = 30.7%
Stop Loss Trigger = 27.5%
Current Closed Equity Return = 25.6%
Our open equity outstanding is ~31% since we started in Dec ‘23. We have been able to capture ~28% returns in closed trades, meaning ~3% open equity still belongs to Mr Market. Until we close the trade it doesn’t yet belong to us!
Subscribe to see the portfolio. You can do it for free using the 7-day trial if you want.
New user guide - Paid Portfolio Posts

Hot Takes with Hank

Think pieces!


TL;DR
Corrections sneaking in...
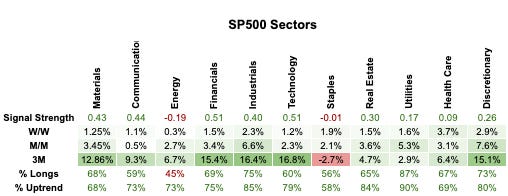
🏥 Health care leading the way this week. Bottom or bounce?
🛳️ Discretionary strongest M/M
🏘️ Real Estate safety rotation again?
💡 Utilities I guess we chose Dr Jekyll.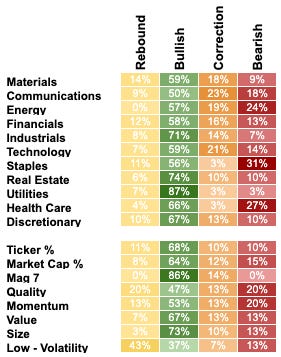
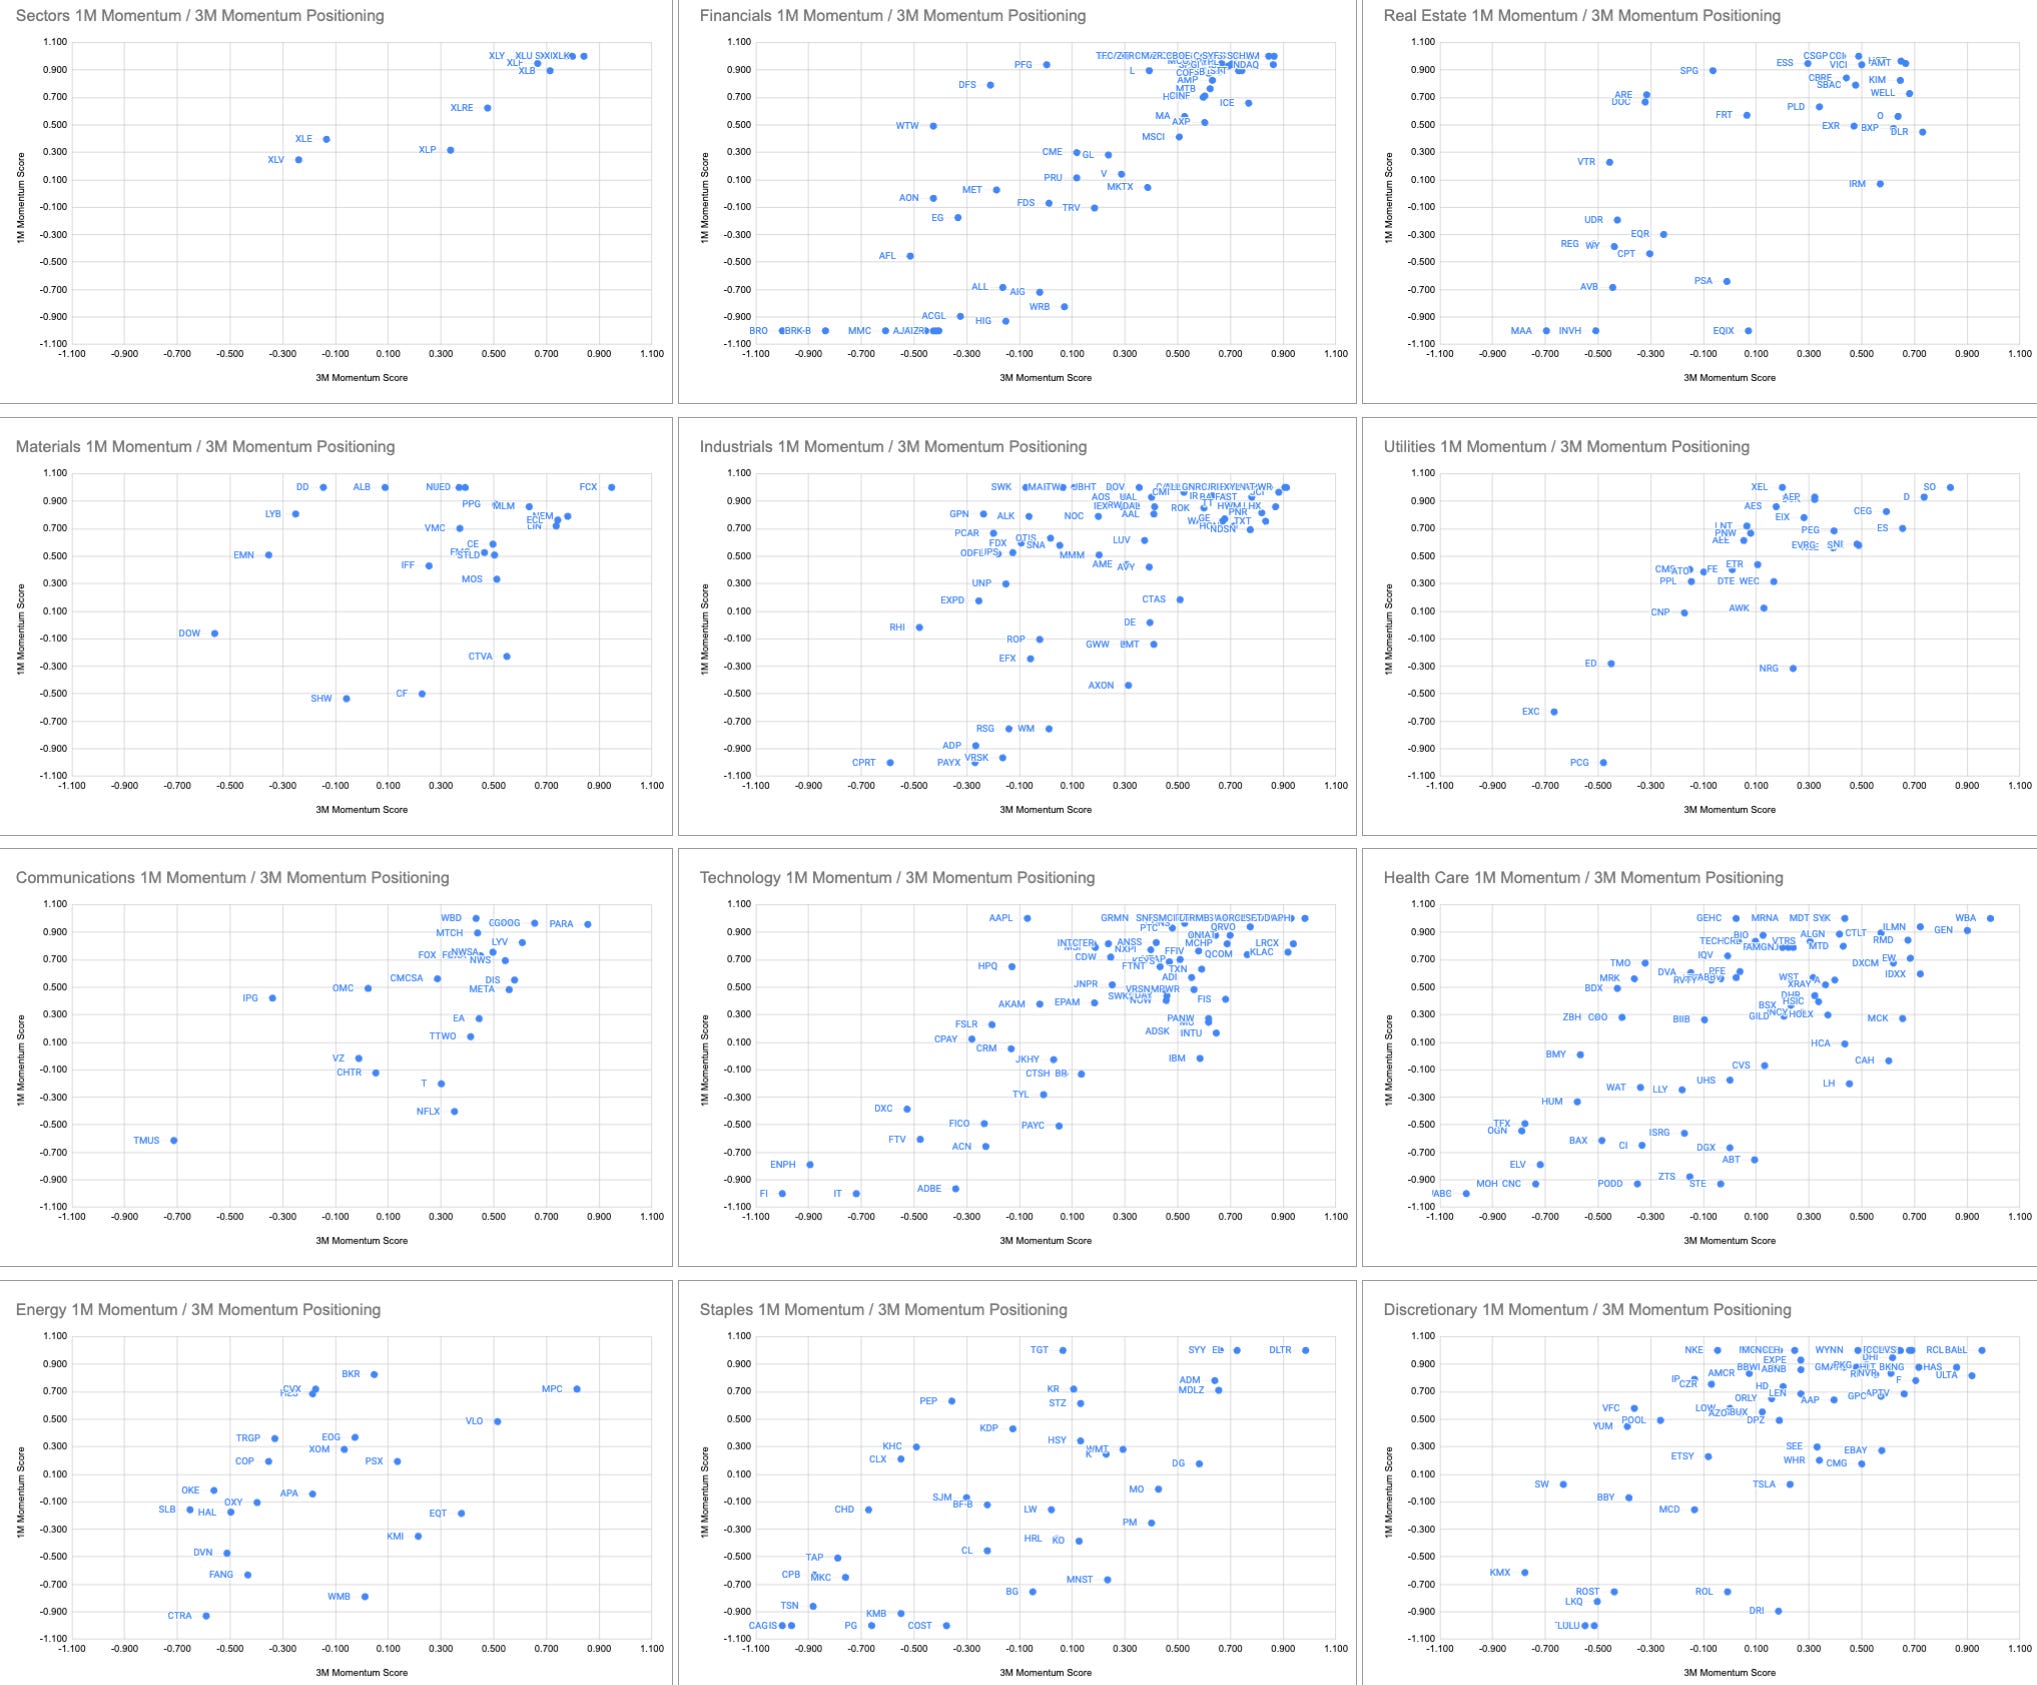
Corrections are starting to sneak in. This chart is a measure of fast and slow momentum, correction means fast momentum is moving lower while slow momentum is still moving higher. This means either fast picks up again and we return to bullish, or slow turns down and we head into bearish.
We have 337 longs in the SP500 and 384 in an uptrend, but remember breadth has been poor and this rally has been driven by 7 stocks.
/s
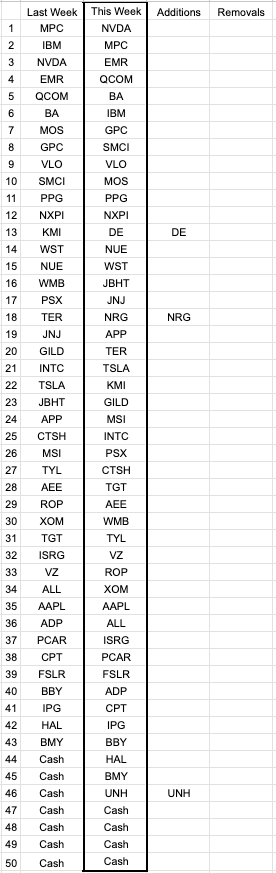
Remove :
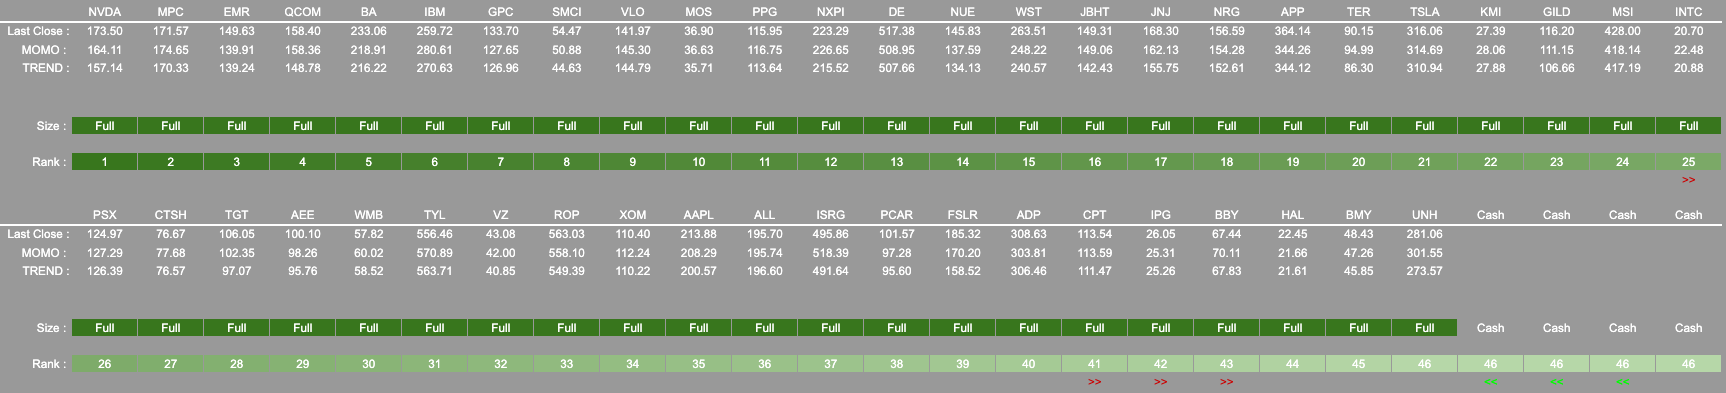
Addition : UNH DE NRG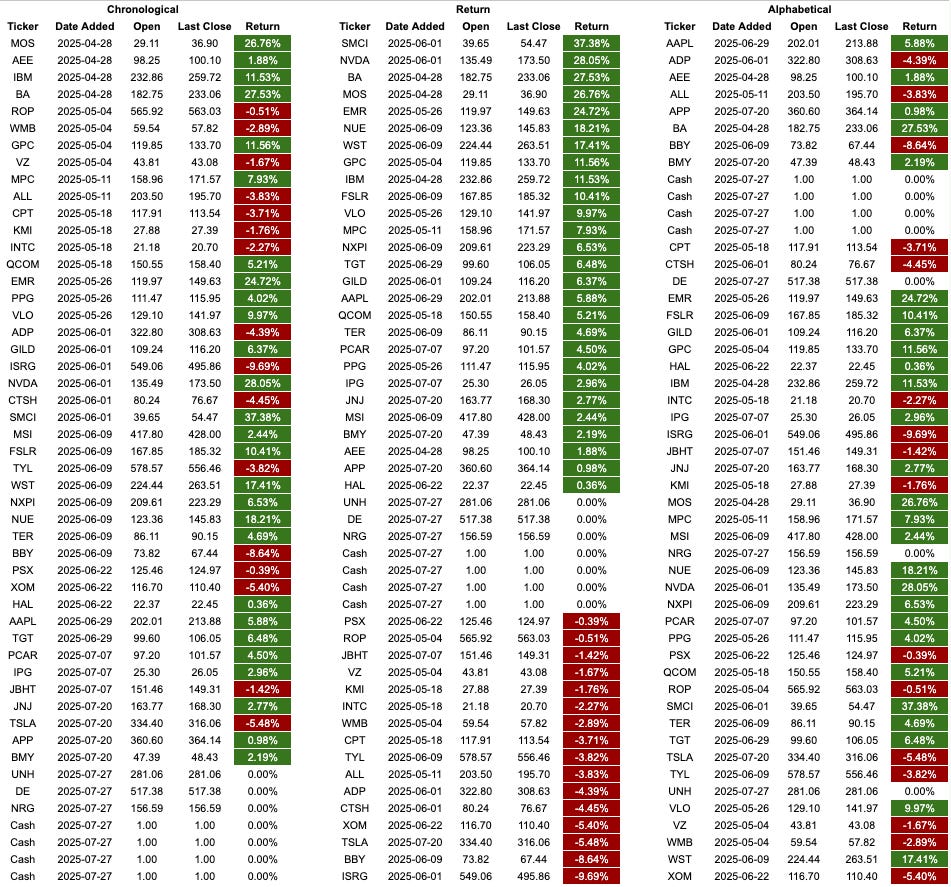
Have a great week, everyone. As always, if there are big moves intra-week I will post updates.
If you have questions please ask. Also, if you want me to cover something in next week’s HTwH post them here.
Dashboard ← Use this link to view the SP500 tickers dashboard.
1M/3M MOMO ← Use this link to find the stock’s positions relative to 1M + 3M momentum.
Signal Strength Dots ← Tracking all tickers in their SoS cycle.
Sub-Sector Signal Strength ←Sub-Sector SoS value chart