
FREE ACCESS Portfolio Update is open to all this week!
Week 30 - Equity Portfolio Update

I highly recommend using the link to view these posts in a desktop browser. Substack limits the size of emails, and since I use a lot of images, some readers have been missing important data by only viewing the truncated email.
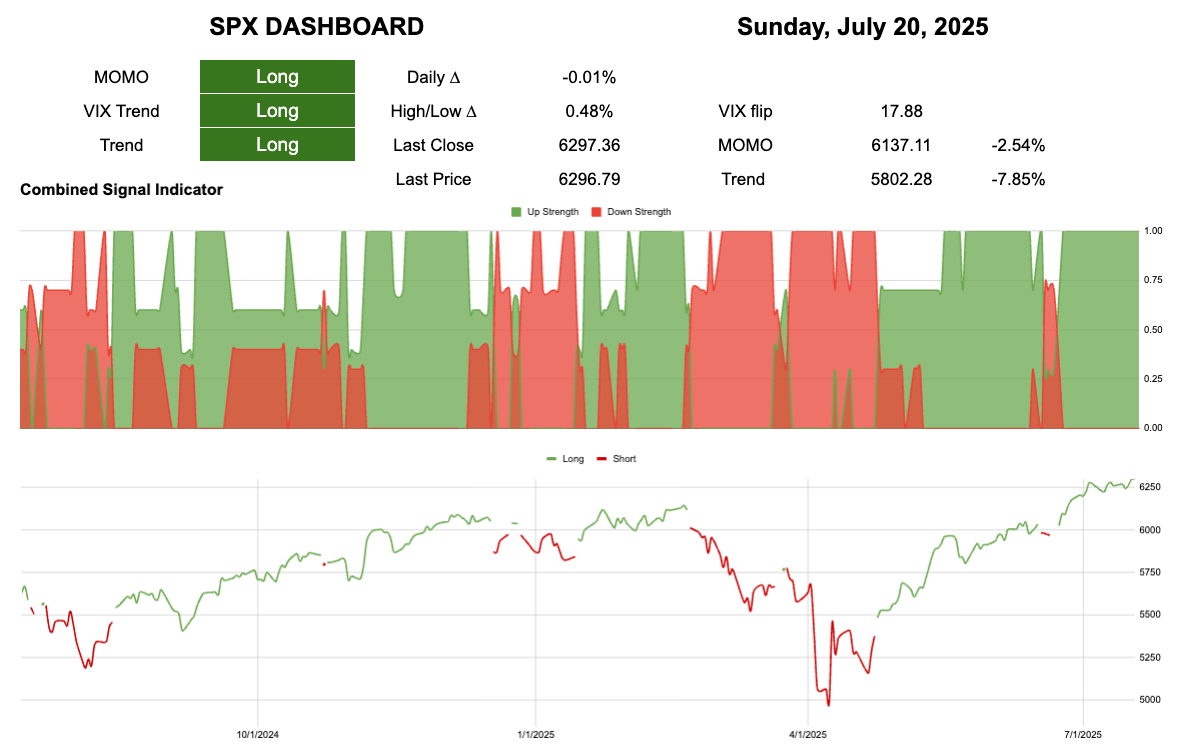
All green on the board.
6137 to break momentum
5802 to break trend
All Strength of Signal (SoS) are rising.
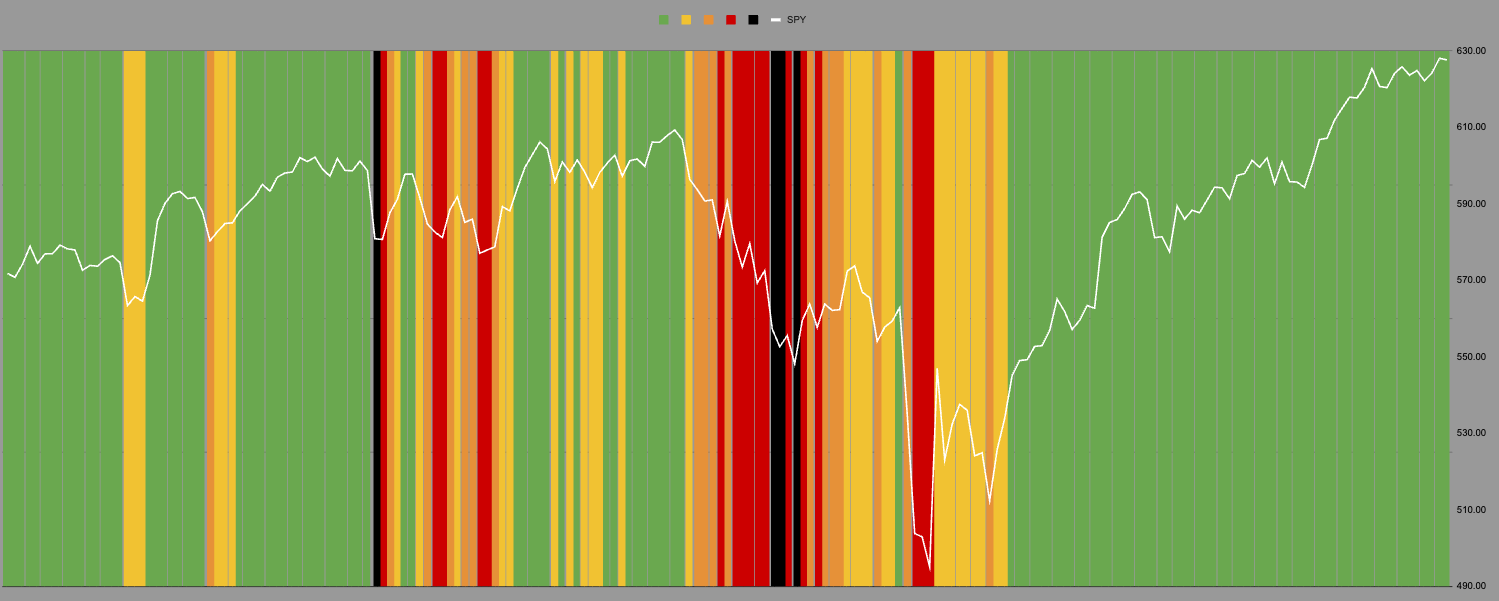
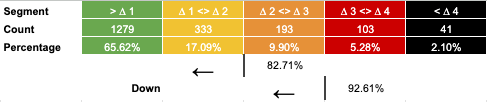
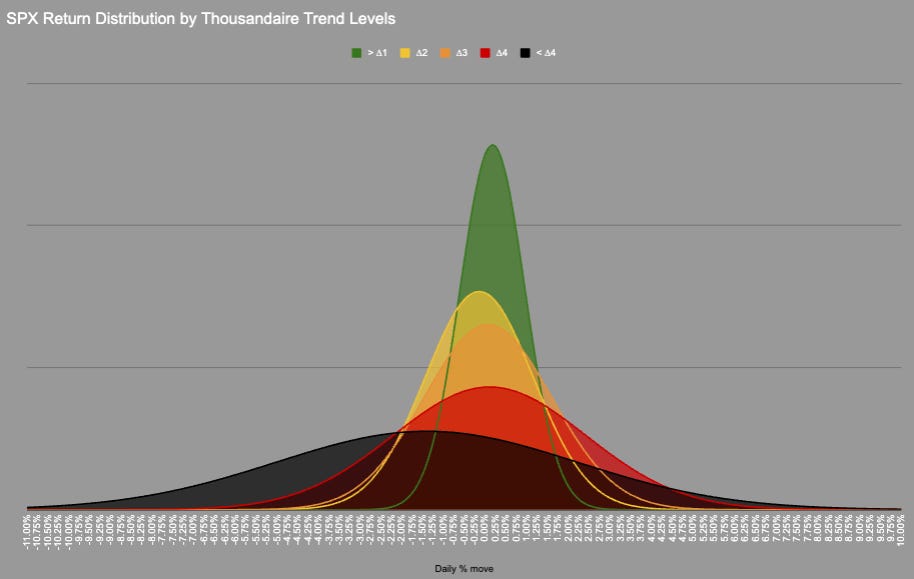
We remain in the green zone where SPX spends 65% of its trading time. This zone has a narrow but positively skewed distribution.
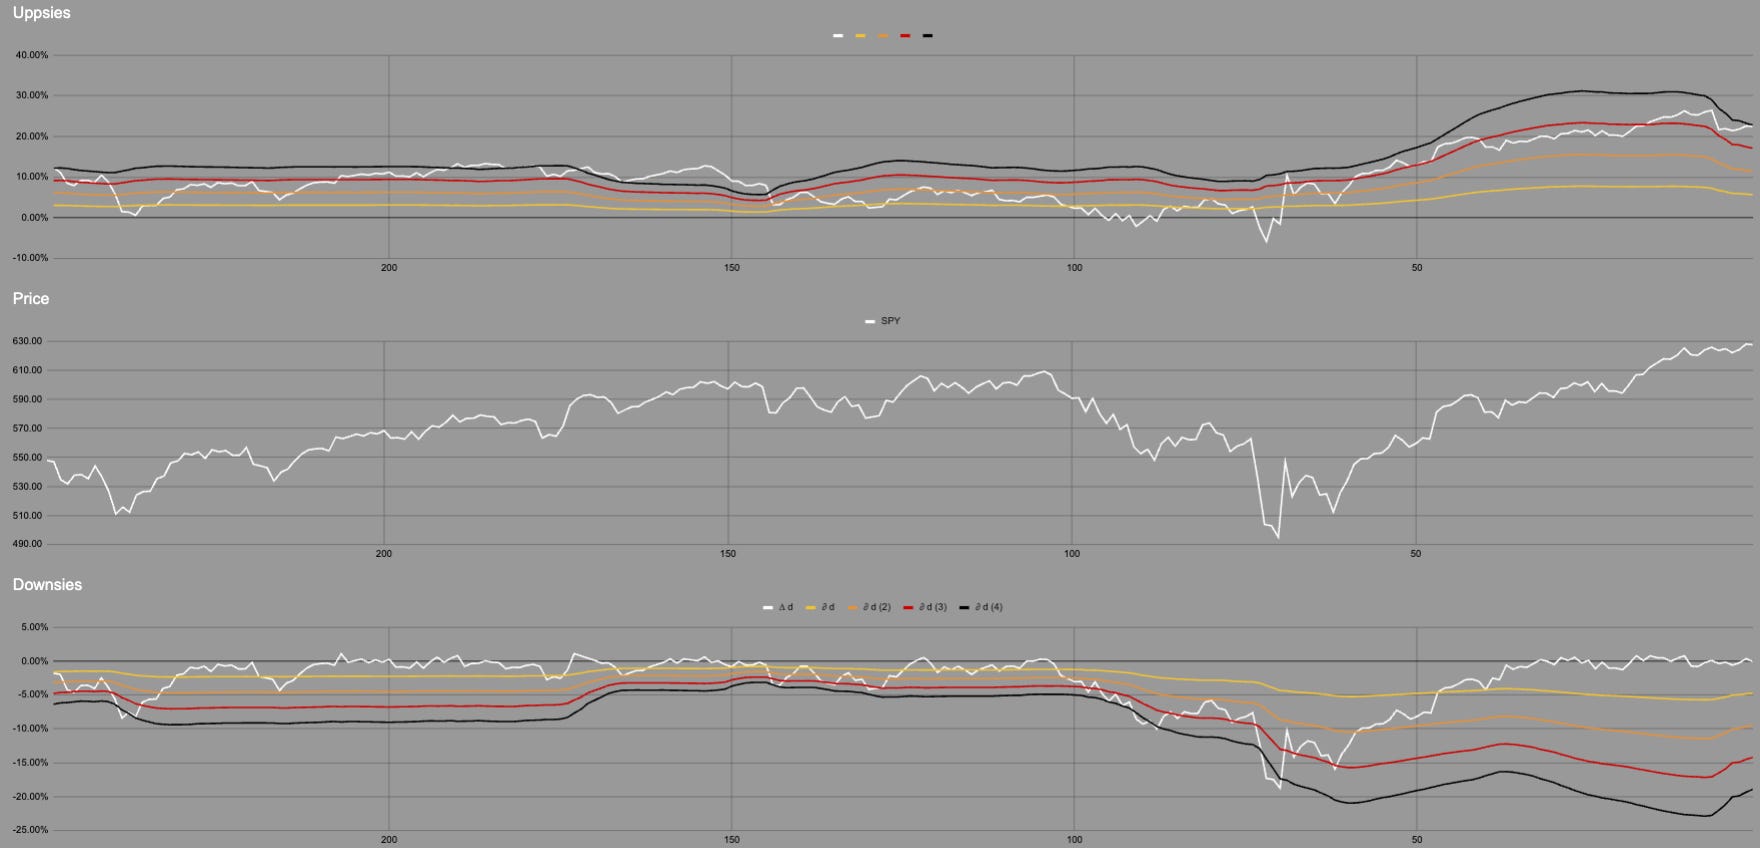
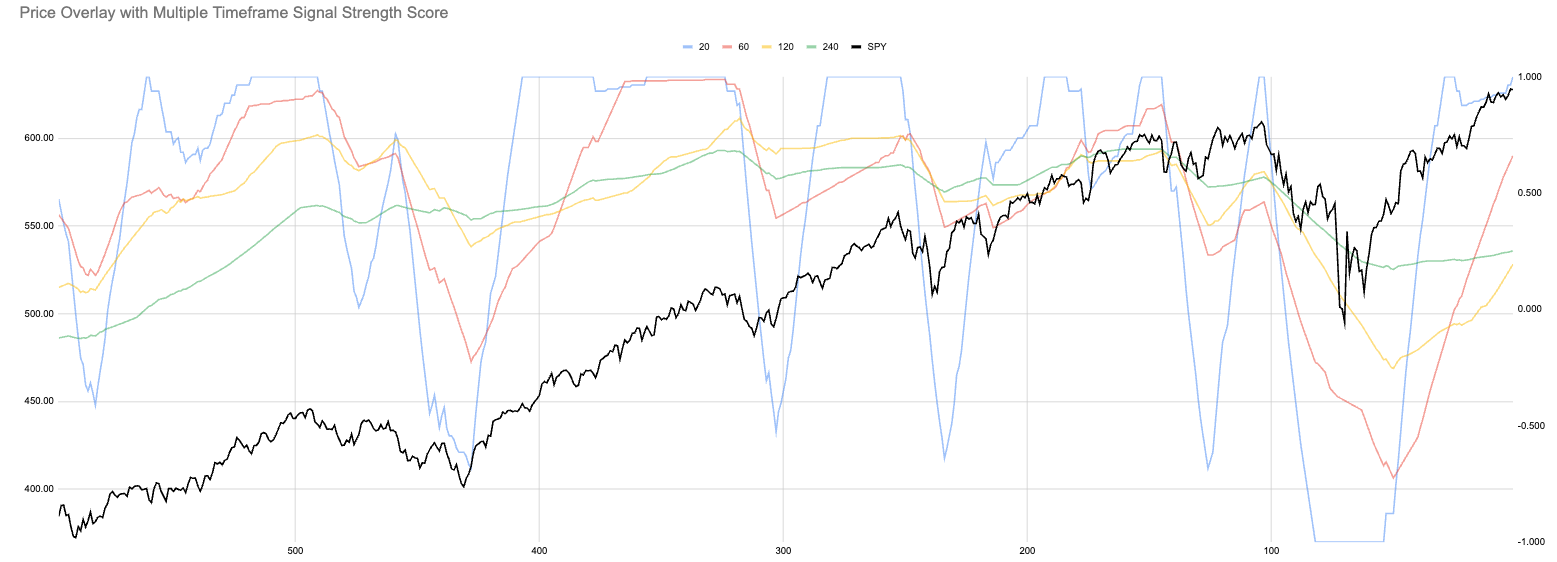
We have had strong momentum with minimal pullbacks. Which makes people uneasy “too far too fast” which is a valid concern. A slowing of momentum in the top portion of this chart doesn’t have to mean falling prices, only that the prices move upwards but more slowly.
This potential pinning or very narrow band for the index could create the conditions for the internals to move more creating single stock volatility while maintaining index volatility compression.
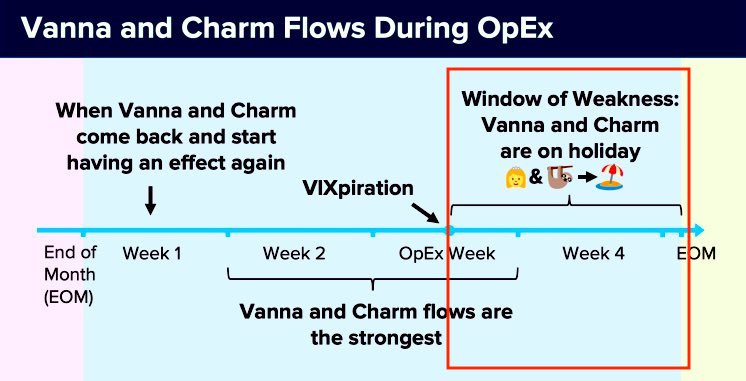
Mr Croissant says we are within the window of weakness.
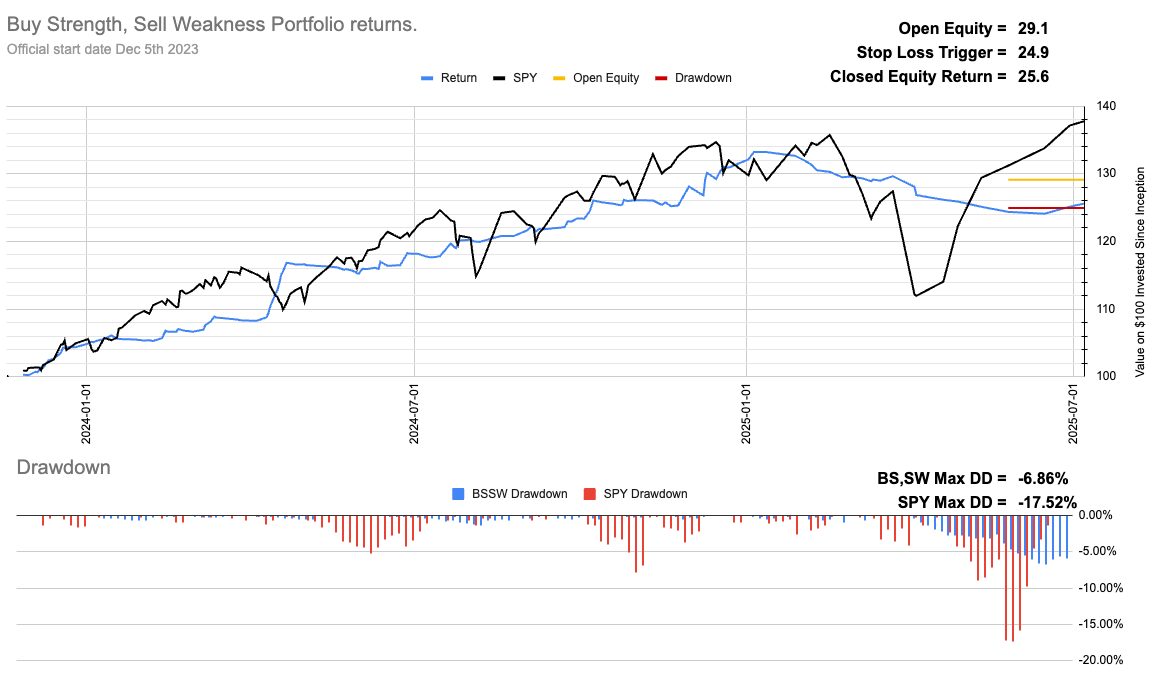
Current Open Equity = 29.1%
Stop Loss Trigger = 24.9%
Current Closed Equity Return = 25.6%
Our open equity outstanding is ~29% since we started in Dec ‘23. We have been able to capture ~26% returns in closed trades, meaning ~4% open equity still belongs to Mr Market. Until we close the trade it doesn’t yet belong to us!
Subscribe to see the portfolio. You can do it for free using the 7-day trial if you want.
New user guide - Paid Portfolio Posts

Hot Takes with Hank

Think pieces!


TL;DR
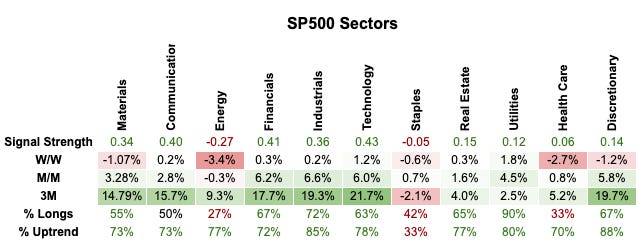
🛢️ Energy needs to prove itself.
🏦 Financials big rotation from Insurance to Banks
💡 Utilities Jekyll and Hyde?
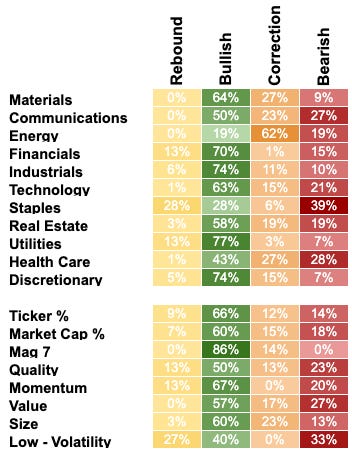
Correction in Energy but this is in line with how we try to track rotations through the market. Energy was as a sector hitting all of our selling pressure and options derived oversold conditions. There was of course an exogenous shock with Iran but the conditions were there for a move to be made. Following those “oversold” measures we now see continuation triggers, energy has to prove its place in the portfolio.
Financials is very underweight considering its strong performance. We were unable to capture the rotation from insurance to banks. Can’t win them all.
Utilities could be interesting because of its Jekyll and Hyde internals. Is it saying safety is key? Or is it again that the high beta tickers within will see big runs?
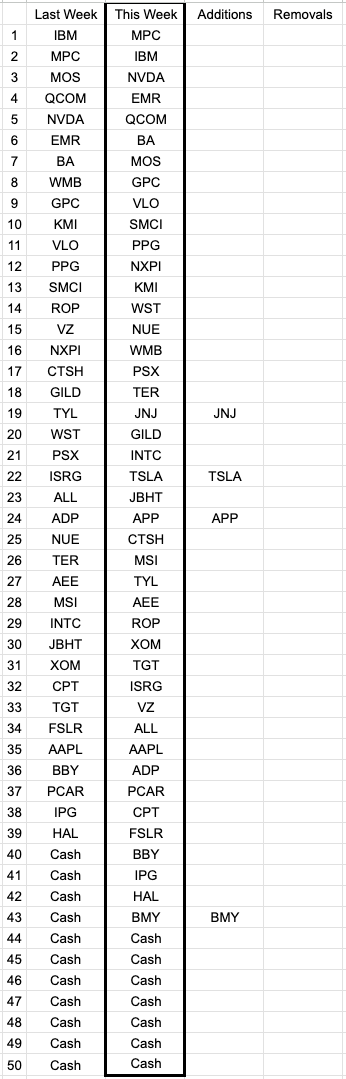
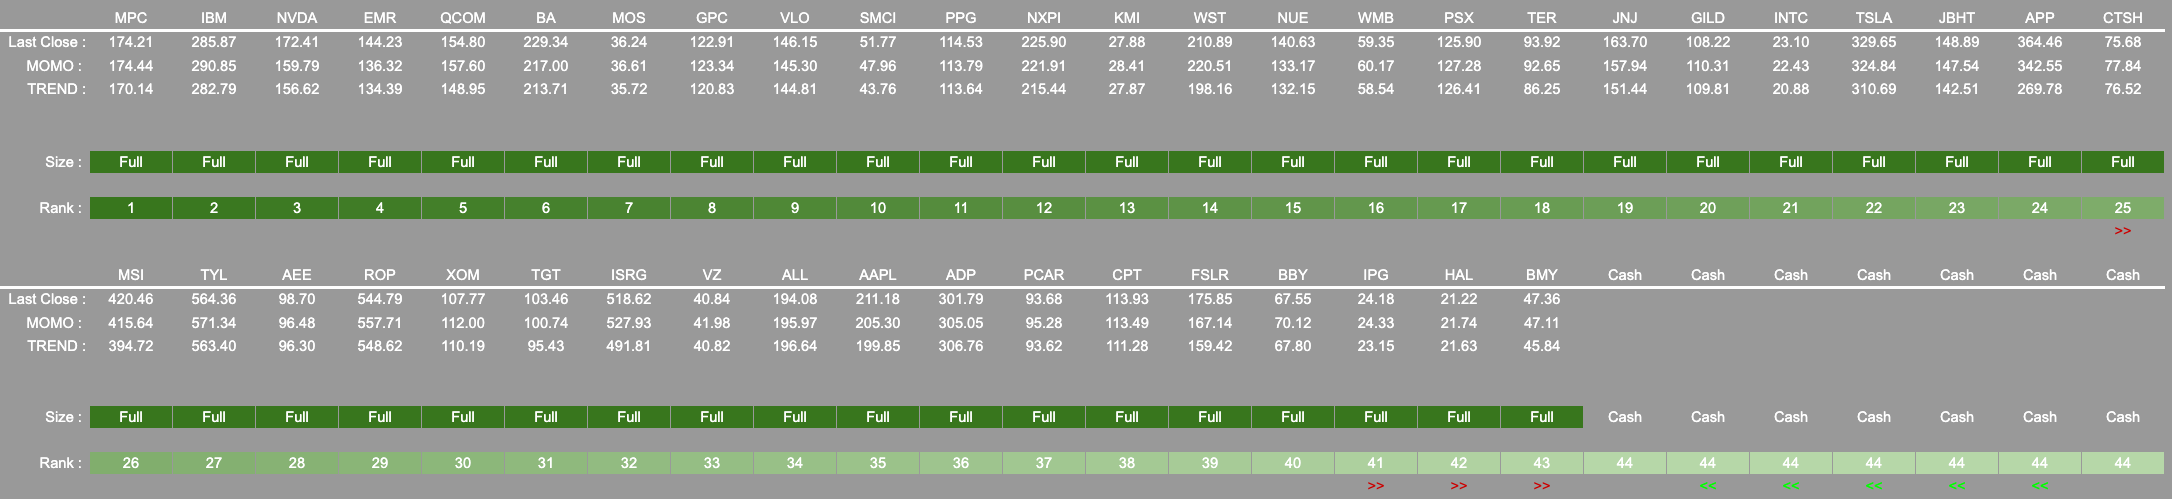
Remove   :

Addition : JNJ TSLA APP BMY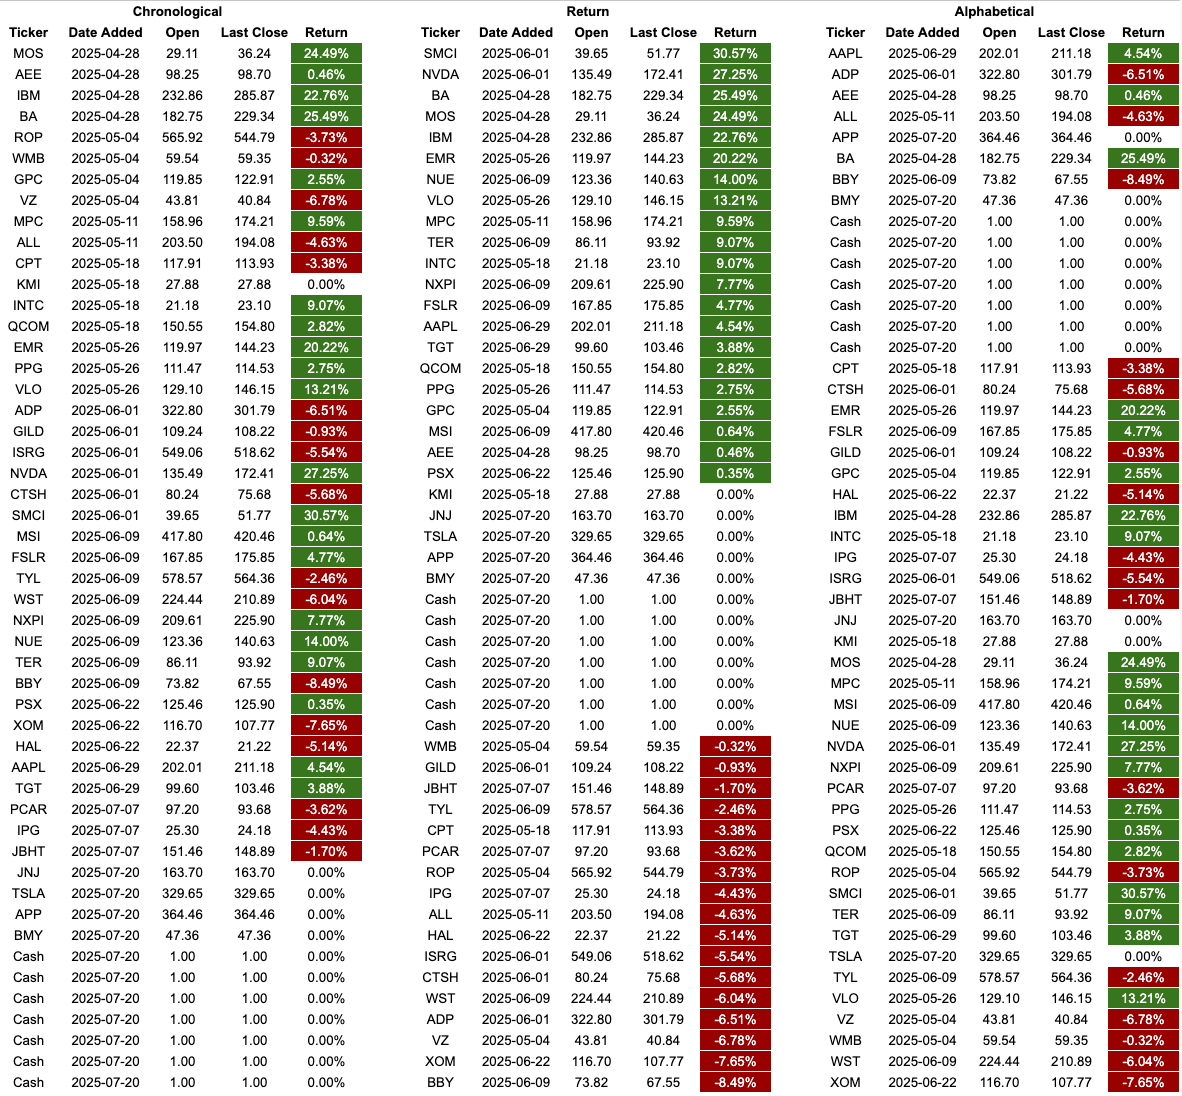
Have a great week, everyone. As always, if there are big moves intra-week I will post updates.
If you have questions please ask. Also, if you want me to cover something in next week’s HTwH post them here or in the discord.
Dashboard ← Use this link to view the SP500 tickers dashboard.
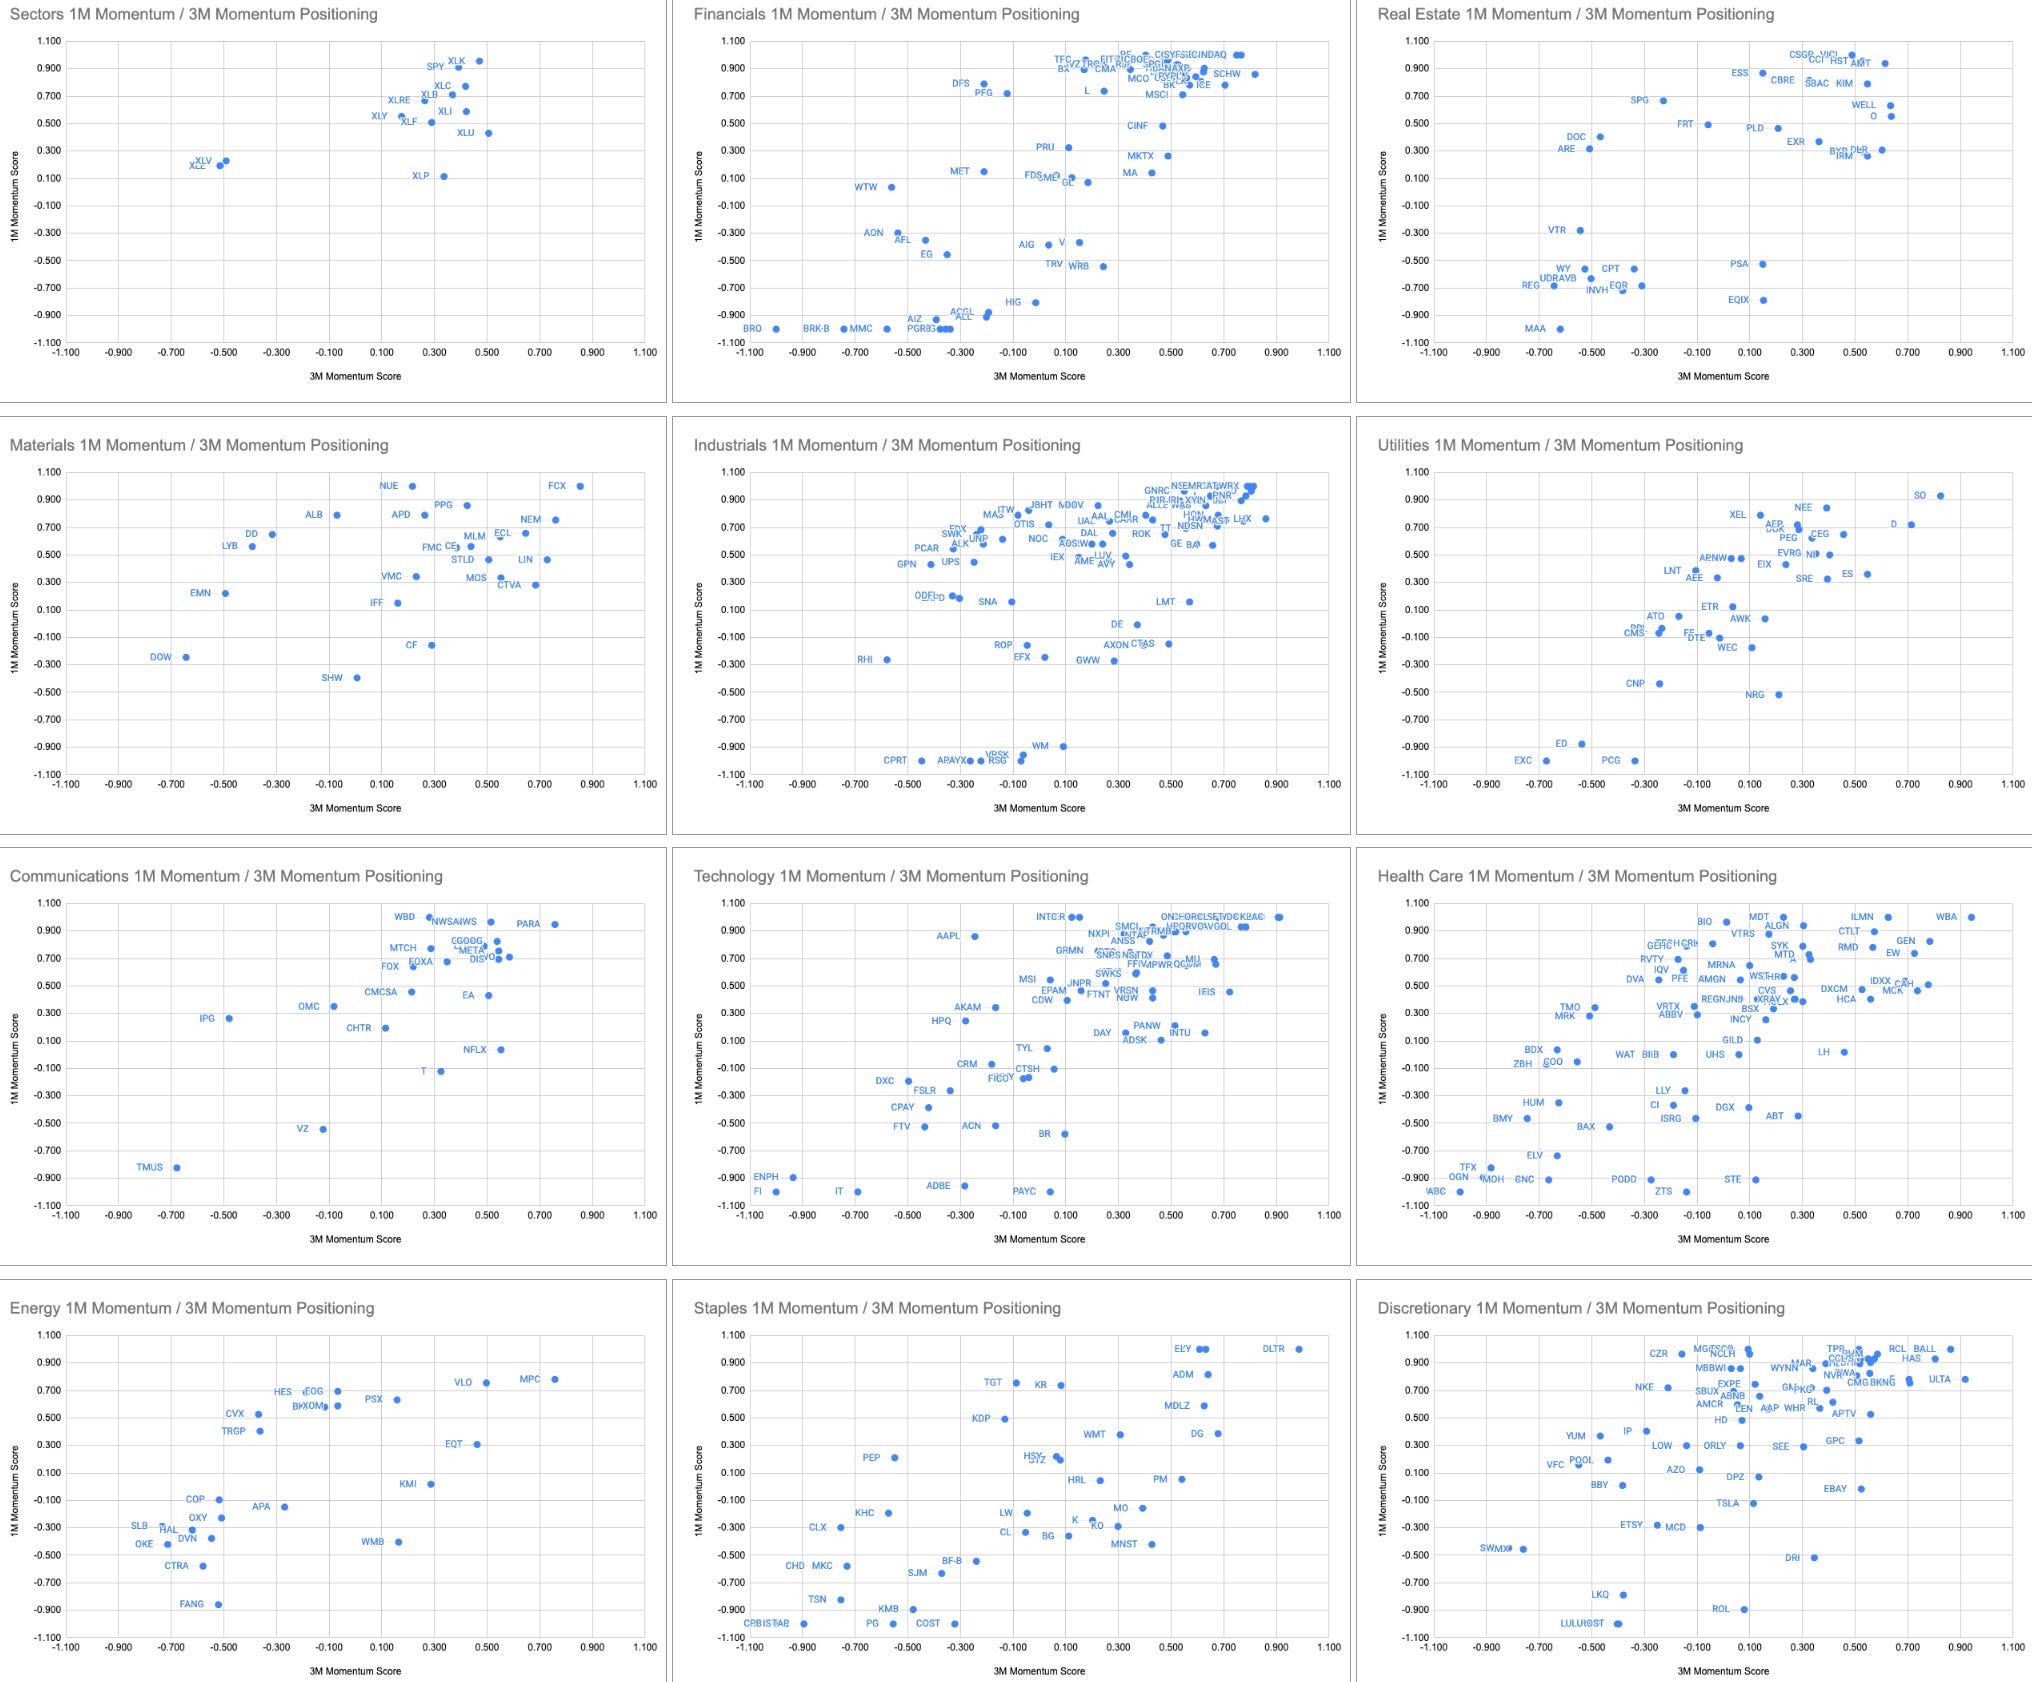
1M/3M MOMO ← Use this link to find the stock’s positions relative to 1M + 3M momentum.
Signal Strength Dots ← Tracking all tickers in their SoS cycle.
Sub-Sector Signal Strength ←Sub-Sector SoS value chart