

Full transparency!
This is throw shit at the wall and see what sticks. People who have followed me for a while cover your ears I am about to be a huge hypocrite.
I copied templates that I use from equity land even though I know they might not be the best fit.
The important part is that although the pictures look the same everything underneath is crypto-specific. My process and how I view things are the same but the model underneath matches the asset.
So things will change. Hopefully with everyone’s help. If your help guides the model hopefully money will be made along the way but I will sub your paid subscription as a thank you.

This uses a combination of momentum signals to place a percentage of tickers in each regime.
An overview of the sectors as I see them. Of course, input is welcome on the sectors and what tickers are where.

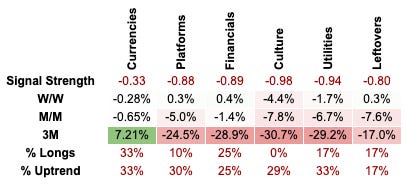
Here we have a Strength of Signal score, performance over timeframes and wether the ticker is long.
An individual representation of the top chart with less fancy colours.

SoS ranks and levels used to calculate stop losses etc

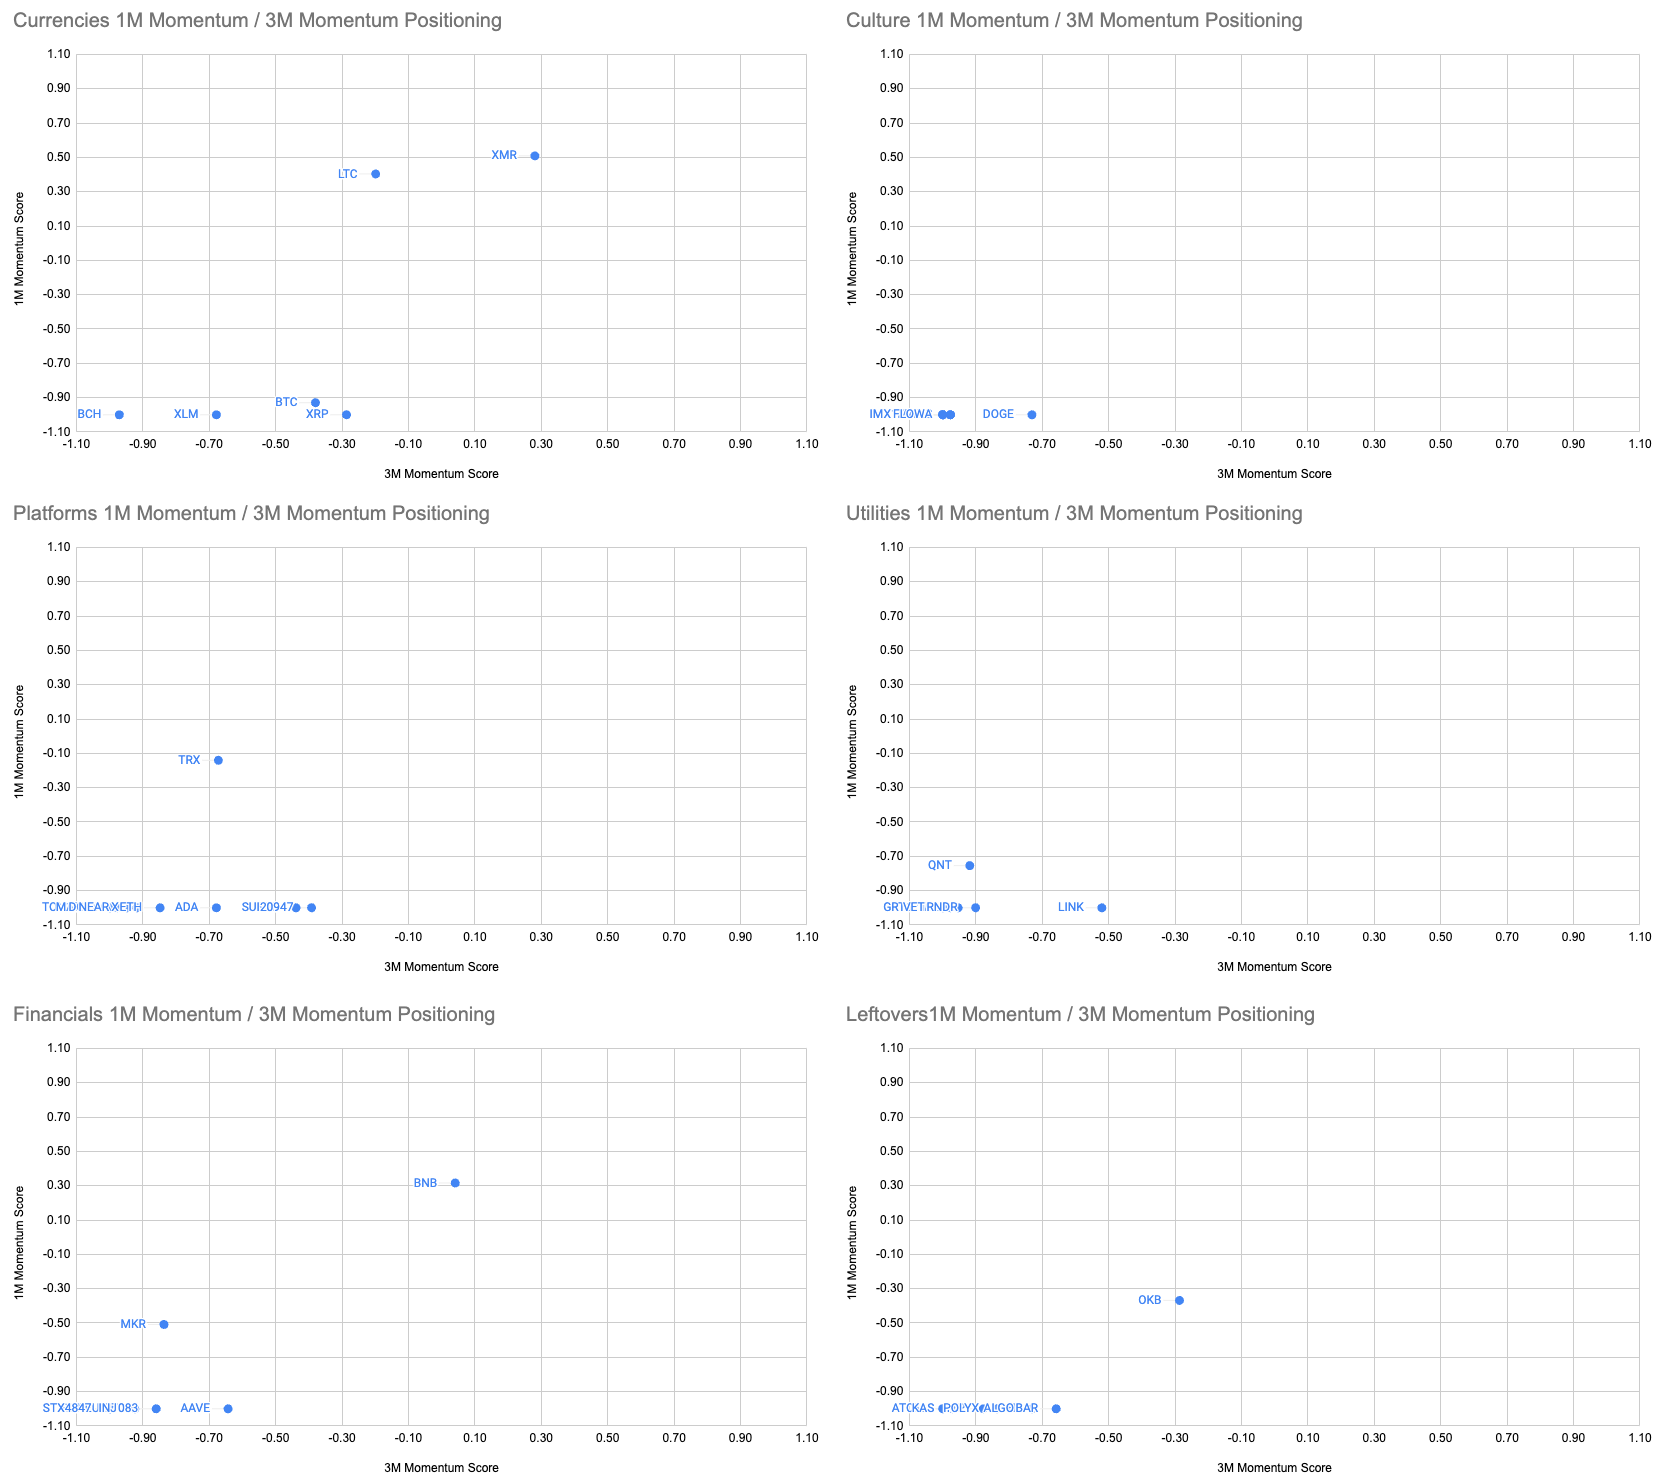
Momentum heatmap.

Cumulative heatmap.
All will be revealed over time please ask any and all questions. Some of these charts may never be seen again dozens more may appear.
Who knows?
Discord channel → https://discord.gg/vsdBws3Rmg
Storm in a Tea Cup?

I highly recommend using the link to view these posts in a desktop browser. Substack limits the size of emails, and since I use a lot of images, some readers have been missing important data by only viewing the truncated email.