Volatility Shifts: Are We Missing a Key Player?
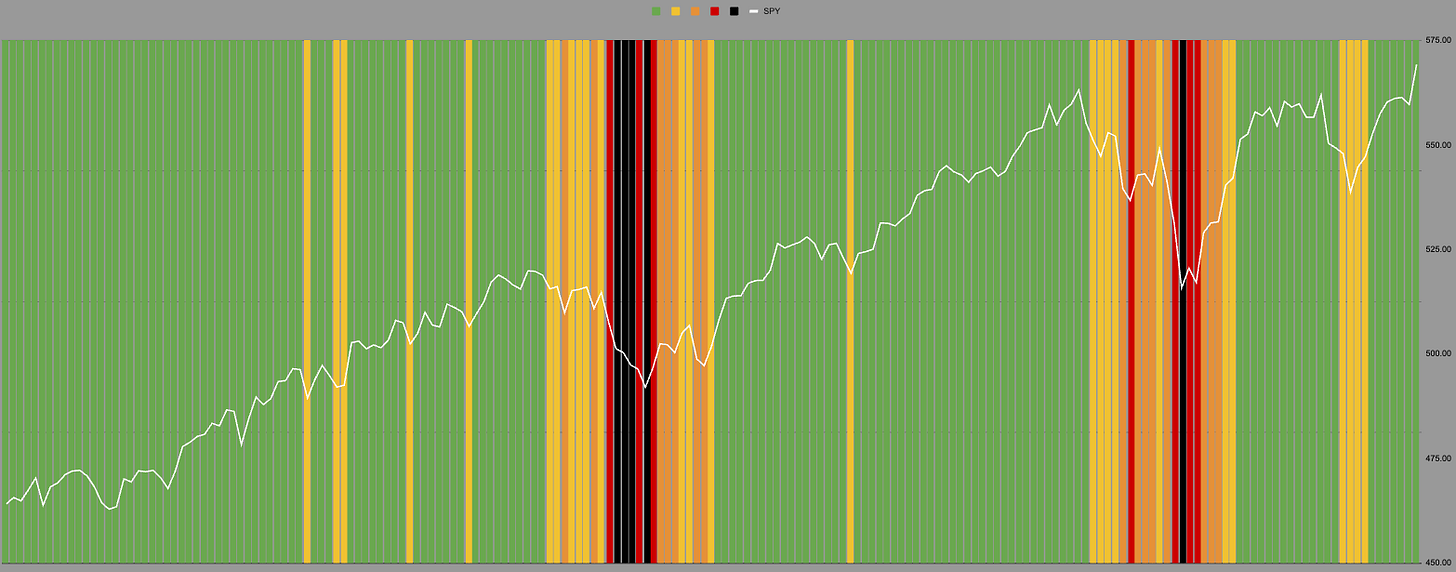
It’s always a good day when you have to adjust the axis higher.
Two things are happening:
September and October 2023 are becoming a smaller part of the volatility calculation that influences trend analysis with each passing day.
August will soon be erased from short-term volatility and momentum calculations.
Is this important? Yes.
There are countless measures and metrics that inform our decision-making process. A factor that has been the number one consideration for the past six months could easily drop to number two—or even ten.
Who knows?
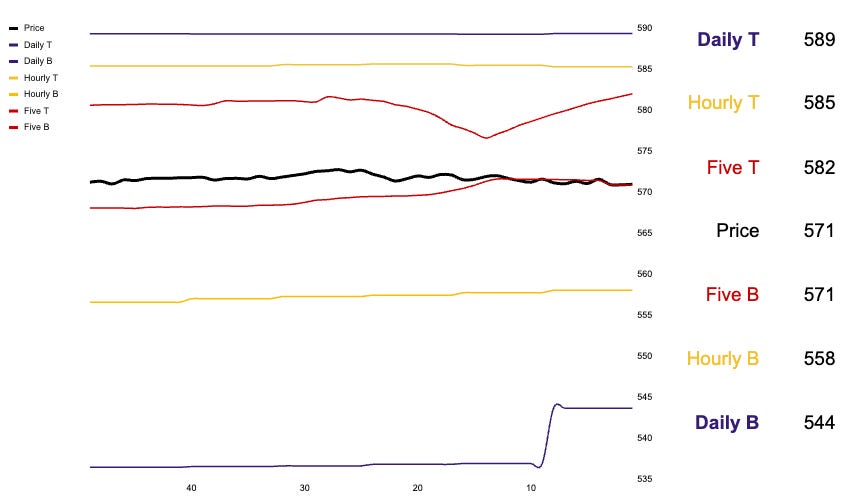
Daily
Hourly
What does it mean that the last signal on the daily charts was a sell?
Why haven’t we seen a buy signal after such a significant move?
What if there’s still a key player yet to step onto the field?
What if, as always, there’s a "wall of worry"—the sentiment that "things have gone too far, too fast"—but some algorithm or system is simply waiting for a specific number? All the ink spilled, blogs written, and eye-catching thumbnails created may be interesting and compelling, but somewhere out there, a computer managing $500 million must act. Either because a new number changed today or a set of old numbers from 50 days ago has disappeared.
Keep reading with a 7-day free trial
Subscribe to Buy Strength, Sell Weakness to keep reading this post and get 7 days of free access to the full post archives.


