Time Shift?
Wednesday 29th may - Daily Equity Update
Pre-US open SPX prices at 5275 which still puts 80-100 points above our decision point.
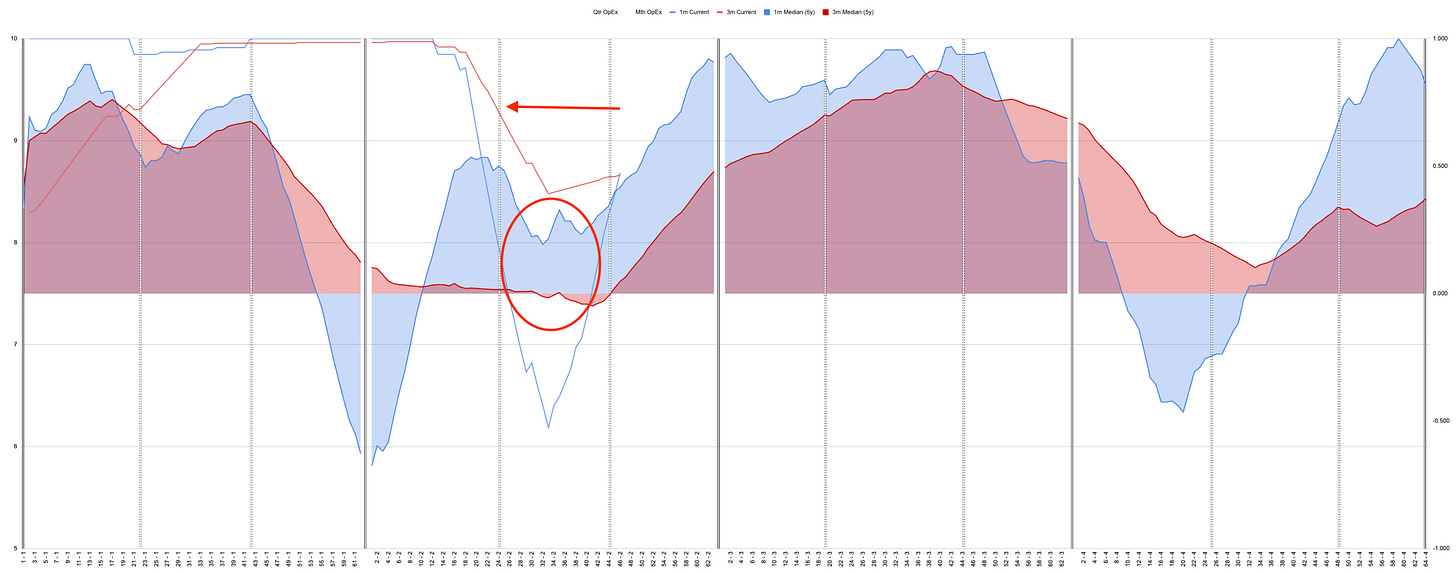
Does a new high matter? This kinda looks like August except then it made a lower high. This time it made a new high.
These two charts are interesting because I listened to Cem Karson recently discuss the compression and expansion of trading days into calendar days. He of course focuses on volatility so the way he explained it was because of holidays last year plus the leap year falling how it did. His point was that we squeezed 60 vol days (the world doesn’t stop when the market does) into 40 trading days.
This year plus the other leap years look so different to the rest. If we time-shifted 2024 back by an OpEx cycle it would look just like every other.
Are we actually coming into this period?
Is Mr Croissant’s “Summer of George” on hold until June OpEx?
Behind this fog of war, I construct a portfolio of the 50 stocks in the SP500 with high and rising signal strength. Free of any priors or bias I don’t care if Twitter says we are going into recession and my system is piling into high beta growth stocks. I have a system to get us out if we are wrong. It’s a game of percentages. It’s boring and often there is nothing to write about, but it beats trying to trade using stories that we tell each other.
Keep reading with a 7-day free trial
Subscribe to Buy Strength, Sell Weakness to keep reading this post and get 7 days of free access to the full post archives.


