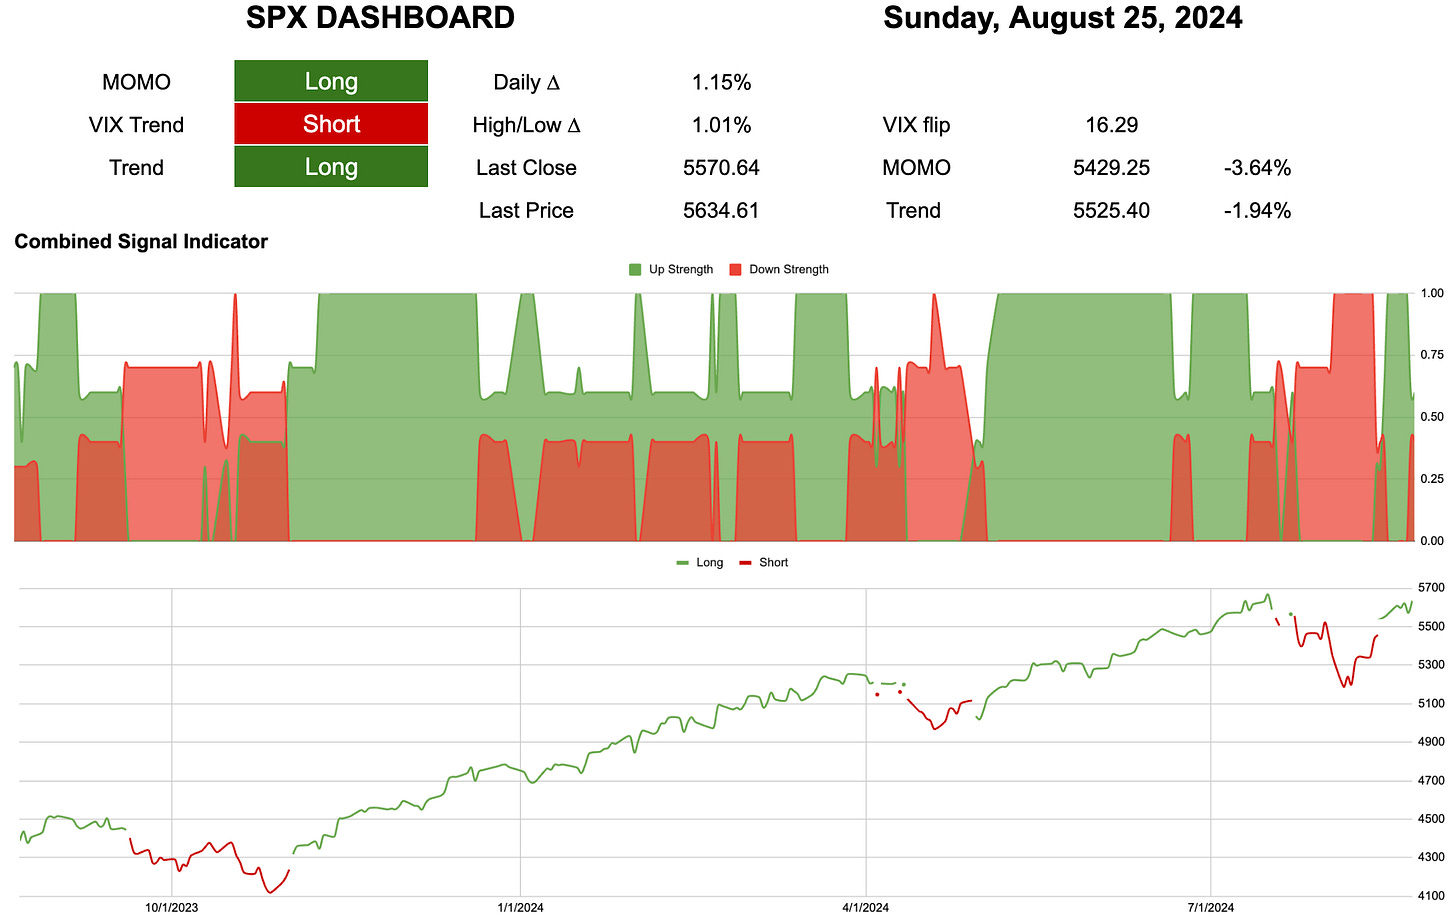
This is my trade. There are many like it, but this one is mine!
VIX echo rumbles on. The speed of both the up and down moves almost ensured that ripples would be felt later down the road.
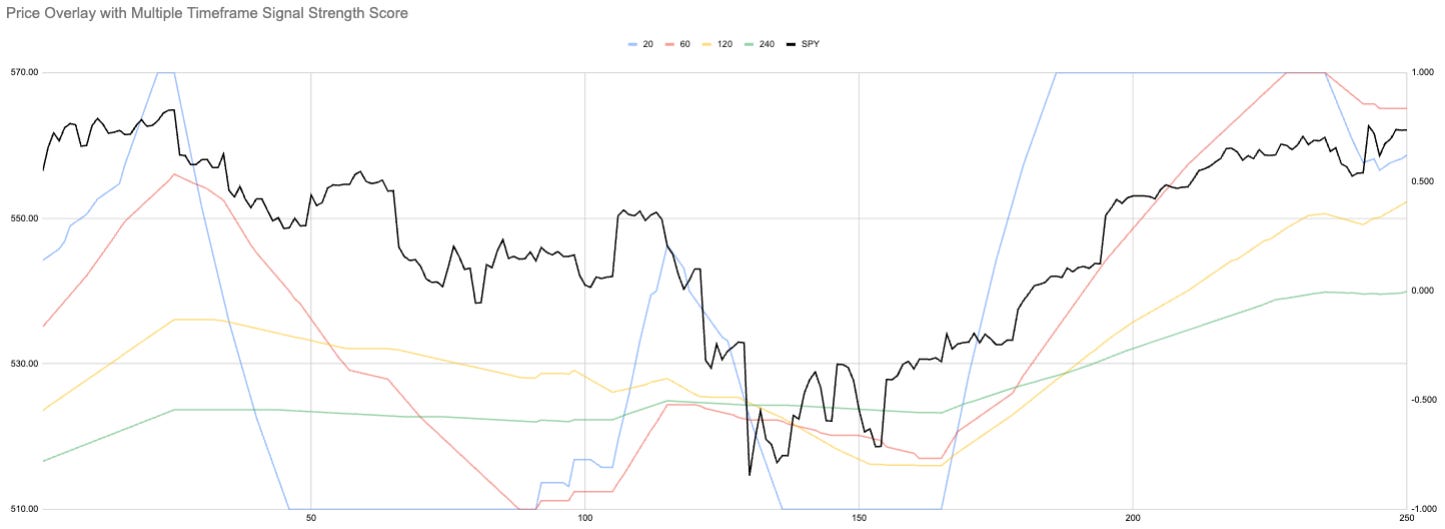
This diagram is from a chemistry paper, but I love it!
Hourly
I have said many times that I have focused on buying. I am not afraid to sell, but I choose not to short. That means I have sell signals, but they should not always be taken as short signals. Once again, my short signals are not as robust as my buy signals!
Hourly momentum has potentially peaked.
How this translates up to the daily level, where my portfolio is decided, could simply mean sideways price action.
Daily
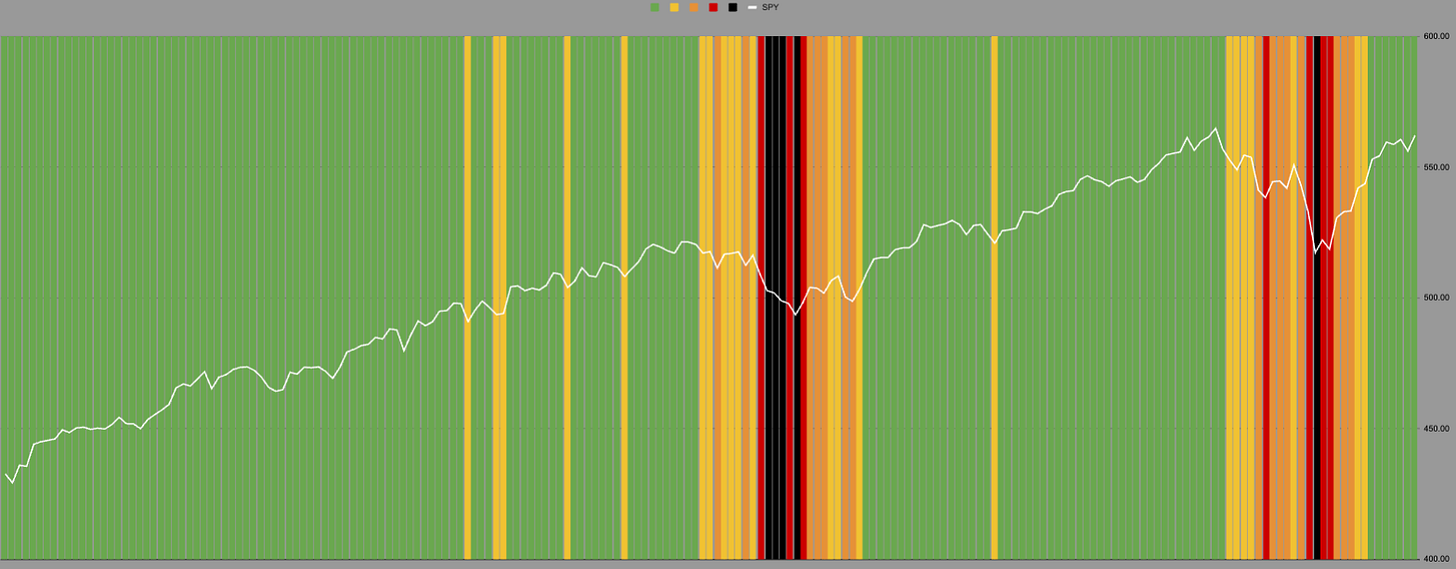
This, like most of my charts, is a mess.
Hint: Pretty charts are often pretty useless.
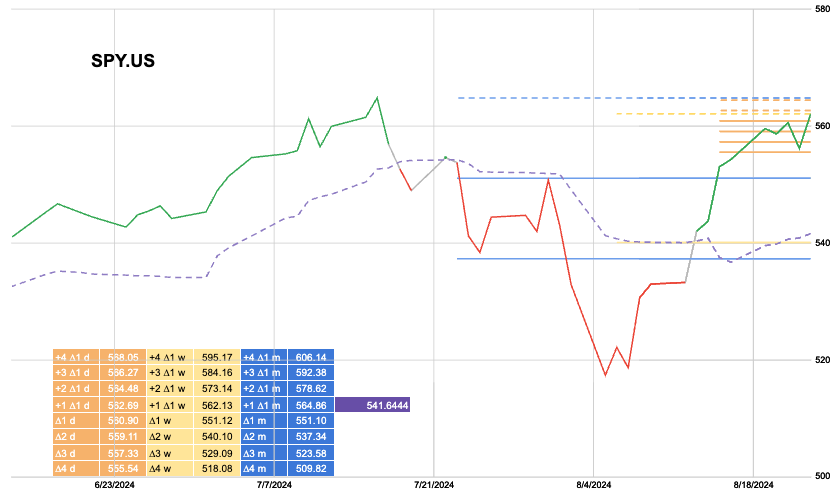
When I first started showing the rainbow charts, I highlighted how often each asset—in this case, SPY—would spend in each “level.” Well, this chart shows all the multiple levels in one. It makes sense when you see how price often interacts with these levels.
For today, ∆2d is the only important one. Based on the hourly sell, I am looking at 559. I will use that level again to buy calls just as I did on Friday. It matters how we get to that level.
This is my trade. There are many like it, but this one is mine! I have done the research. I have all the data; you do not! I am only showing an action I am taking based on this knowledge. Do your own research! I am a random idiot on the internet!
Paid subscribers got the updated portfolio post yesterday.
Current closed equity return = 20.8%
Current open equity = 28%
If all current positions close at stops our return = 21.8%


