
SimpleSPYman
Week 16 - SPX/SPY Index Update

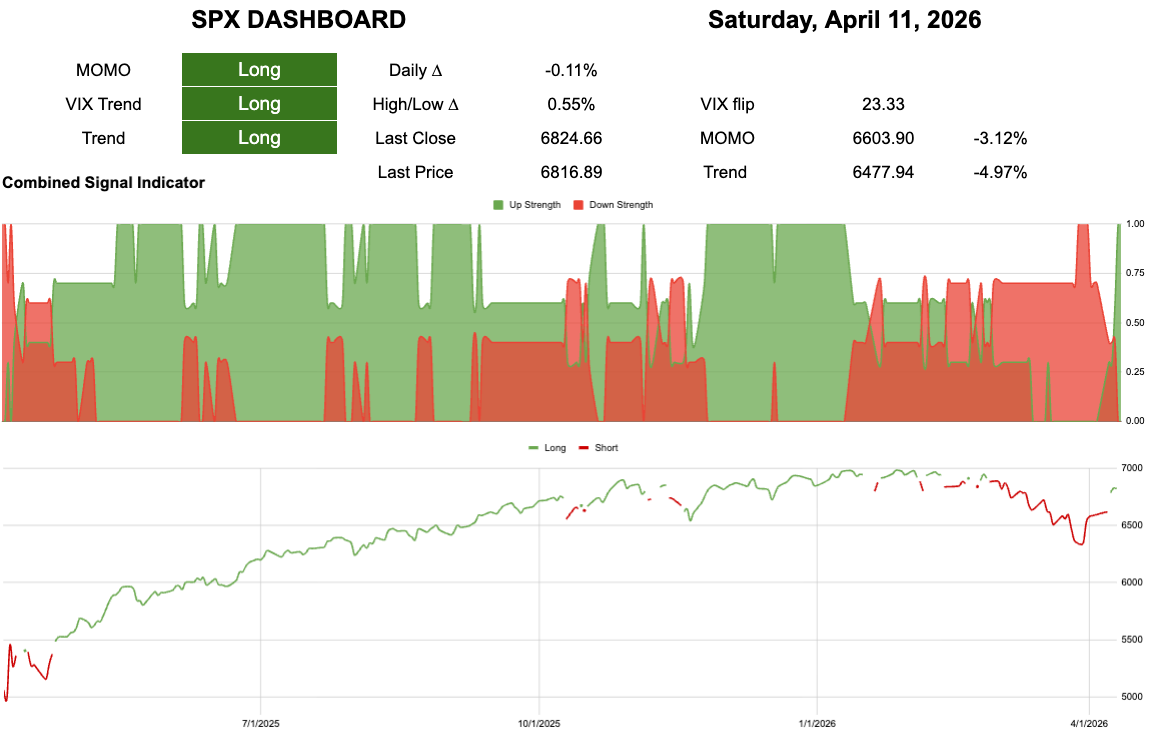
6603 -3.12% to break momentum
6477 -4.97% to break trend
I cannot make it any simpler than this!

Ooh look at that, vol is starting to compress! I have no idea who has been talking about this over and over again in fact so many times he is even boring himself talking about the same thing, but weirdly it is the only thing that over time really matters but everyone keeps paying more attention to the useless stuff because it is shiny and you get to pretend to be a macro bro instead of just doing the same boring stuff over and over again because it works..
All squiggles and no macro make Chris a dull boy.All squiggles and no macro make Chris a dull boy.All squiggles and no macro make Chris a dull boy.All squiggles and no macro make Chris a dull boy.All squiggles and no macro make Chris a dull boy.All squiggles and no macro make Chris a dull boy.All squiggles and no macro make Chris a dull boy.
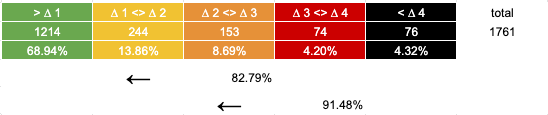
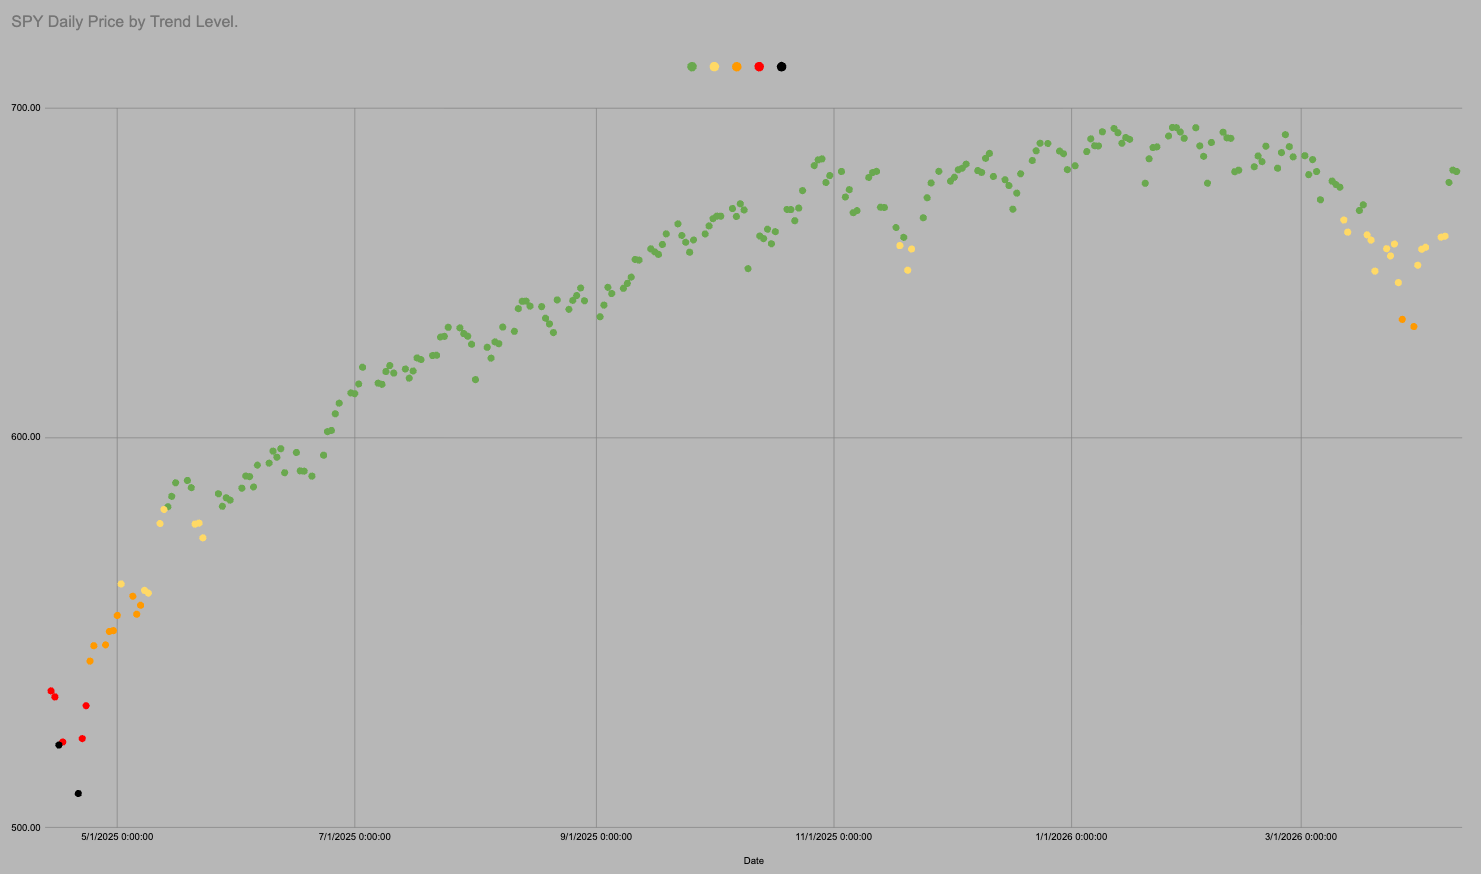
It is all the same chart so I can use all the same data. In the last 1761 trading days SPY has been above “trend” i.e. in green or yellow 83% of days.
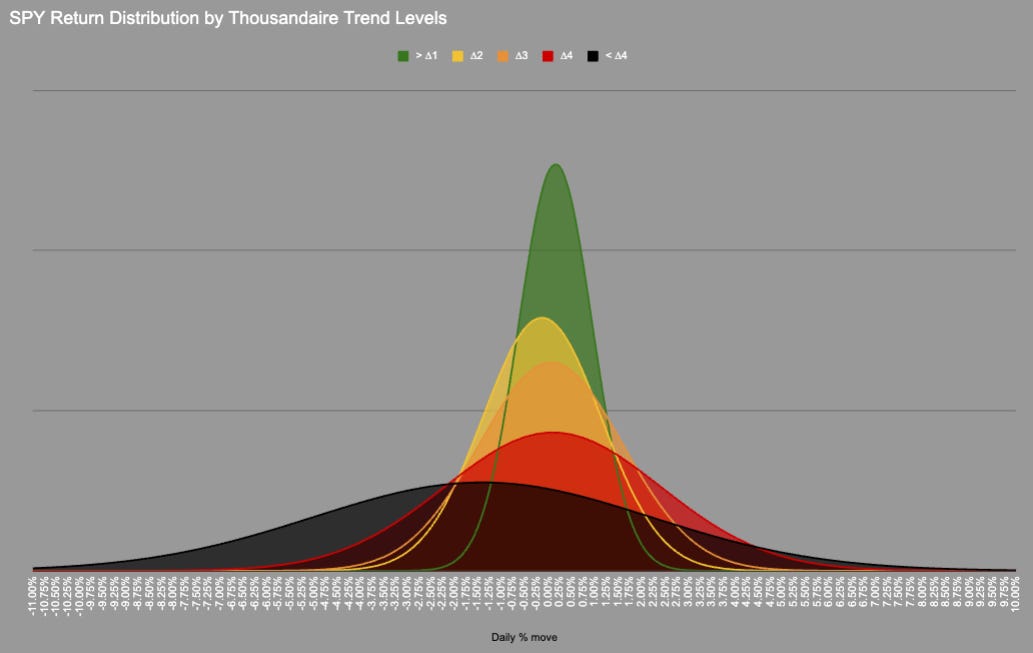
We could probably include orange as the distribution is very similar, but we need a transition point.
In 1761 trading days price has never moved directly from Green into Red/Black there is always an intermezzo hangout in Orange.
