
SimpleSPYman
Week 17 - SPX/SPY Index Update

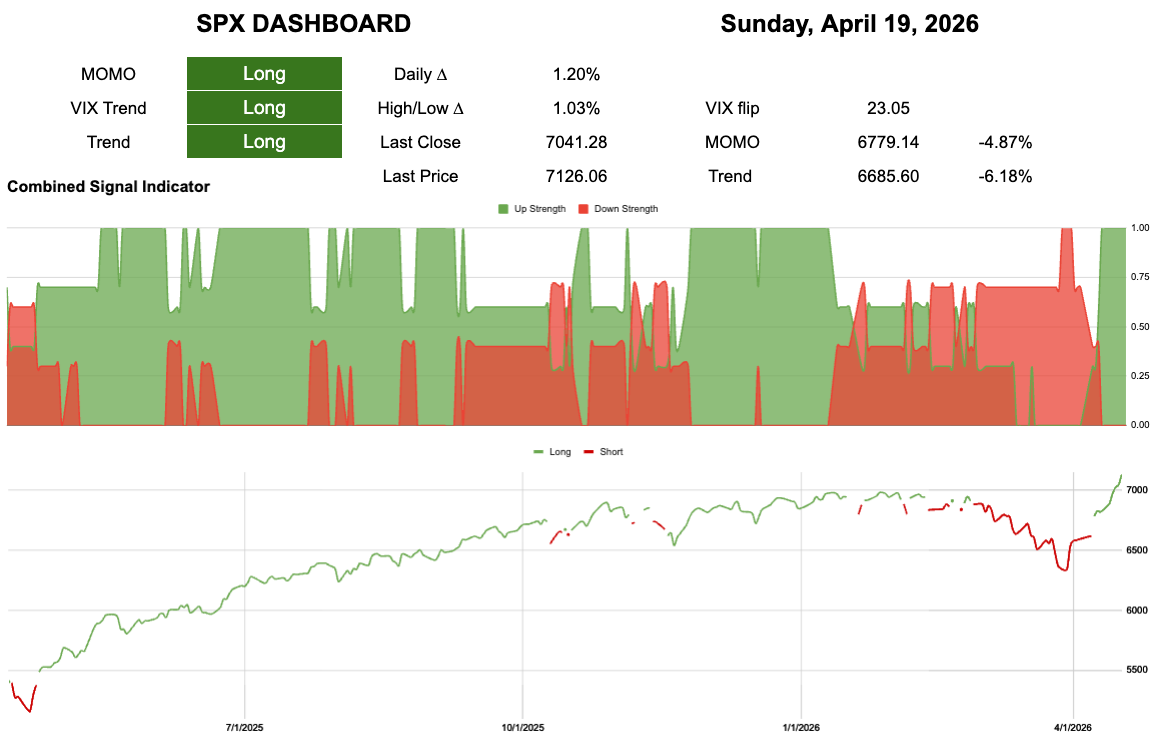
6779 -4.87% to break momentum
6685 -6.18% to break trend
I cannot make it any simpler than this!
I feel like I am saying the same thing over and over again which is a good thing. I think.
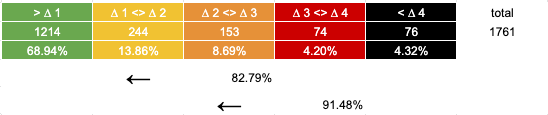
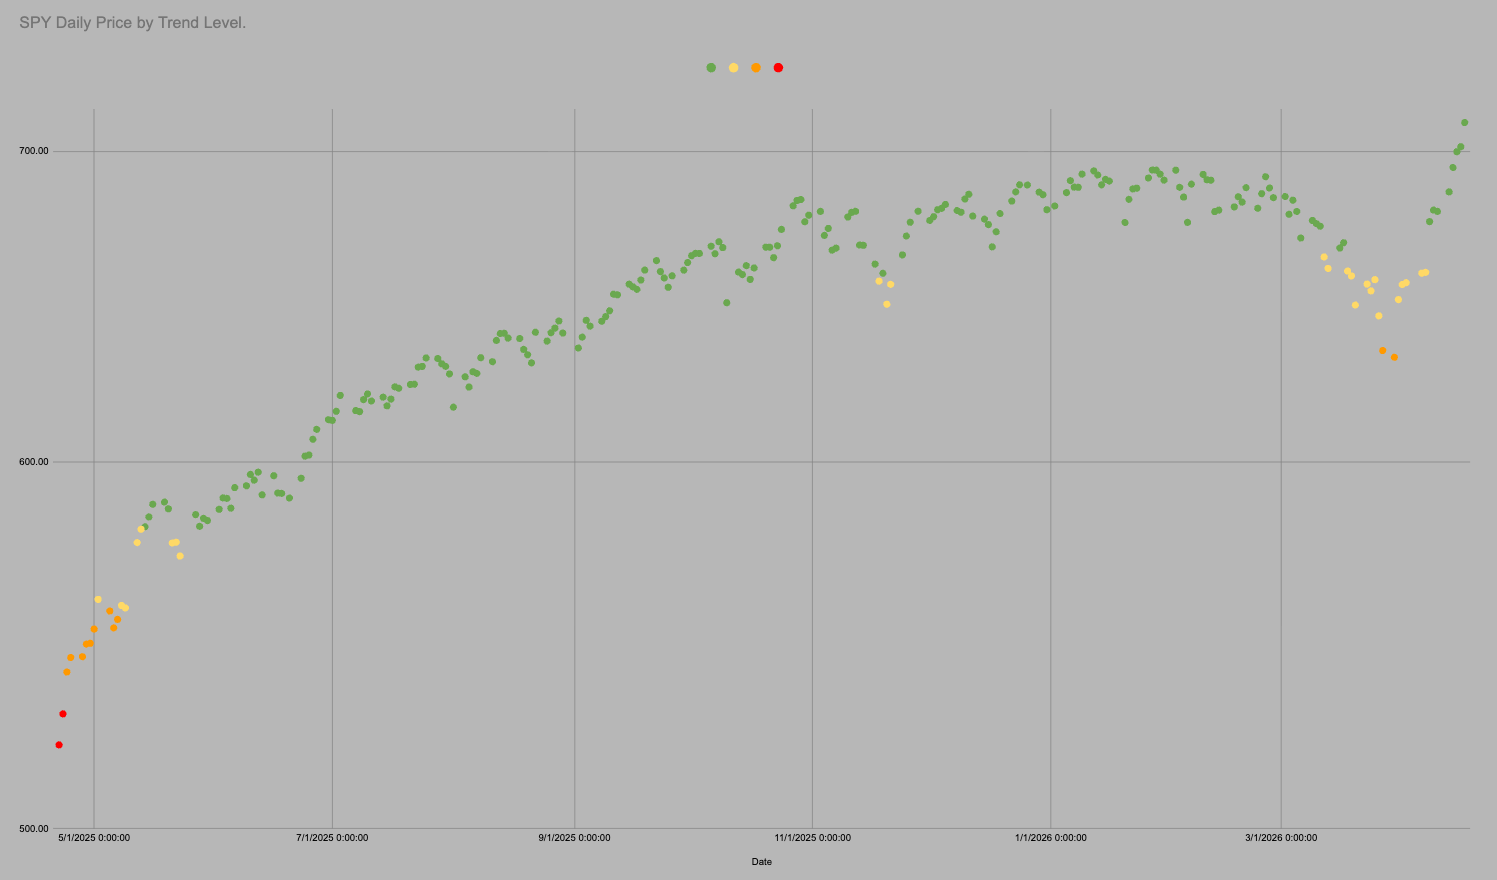
It is all the same chart so I can use all the same data. In the last 1761 trading days SPY has been above “trend” i.e. in green or yellow 83% of days.
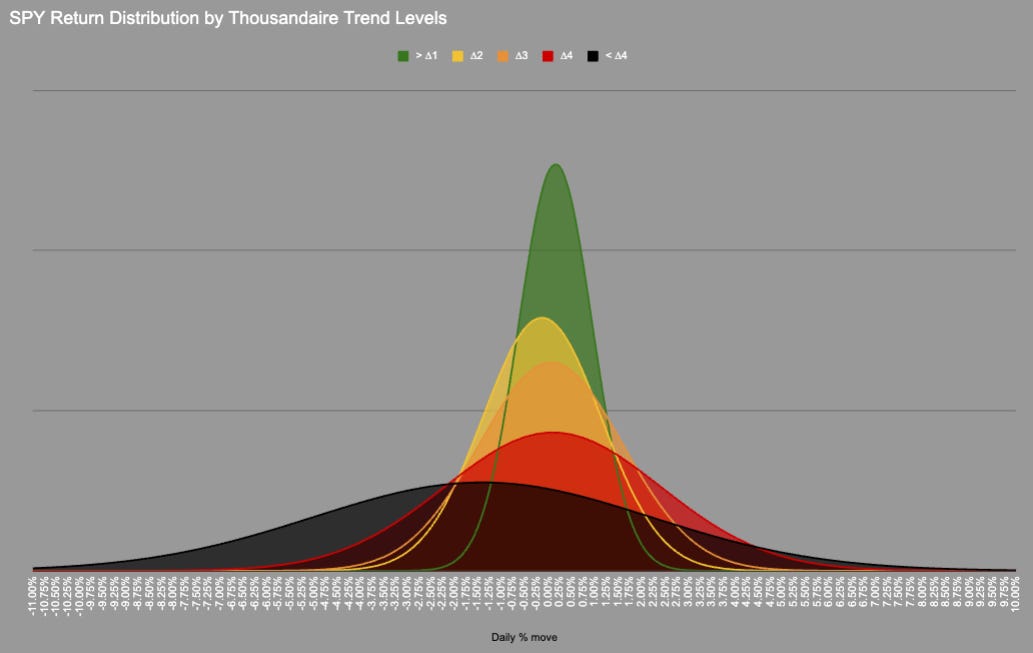
We could probably include orange as the distribution is very similar, but we need a transition point.
In 1761 trading days price has never moved directly from Green into Red/Black there is always an intermezzo hangout in Orange.
