QQQ vs IWM
Week 26 - Weekly Equity Update
We are still max long on the combined indicator at the index level.
I have been highlighting the shift beneath the surface over the last few weeks. When you look at individual tickers do they act more like QQQ and trend or like IWM which mean reverts?
You can see this difference in the indexes using a couple of our measures here.
Here we have the daily data on individual Signal strength scores for SPY.
Here is the hourly data on IWM.
Again hourly data but a slightly different view using a combined SoS indicator value. The stinky fingers proctology signal was triggered at the open on 6/17. The best returns come when these two trigger in pairs. It doesn't happen simultaneously due to what they are both measuring.
The point to make is something has to shift to a long on the lower timeframes before it will come on the daily.
Open question: What kind of person are you? If the IWMy stuff regains strength do you believe the QQQy stuff has to mean revert? Or do you believe more fuel to go higher due to both components being long?
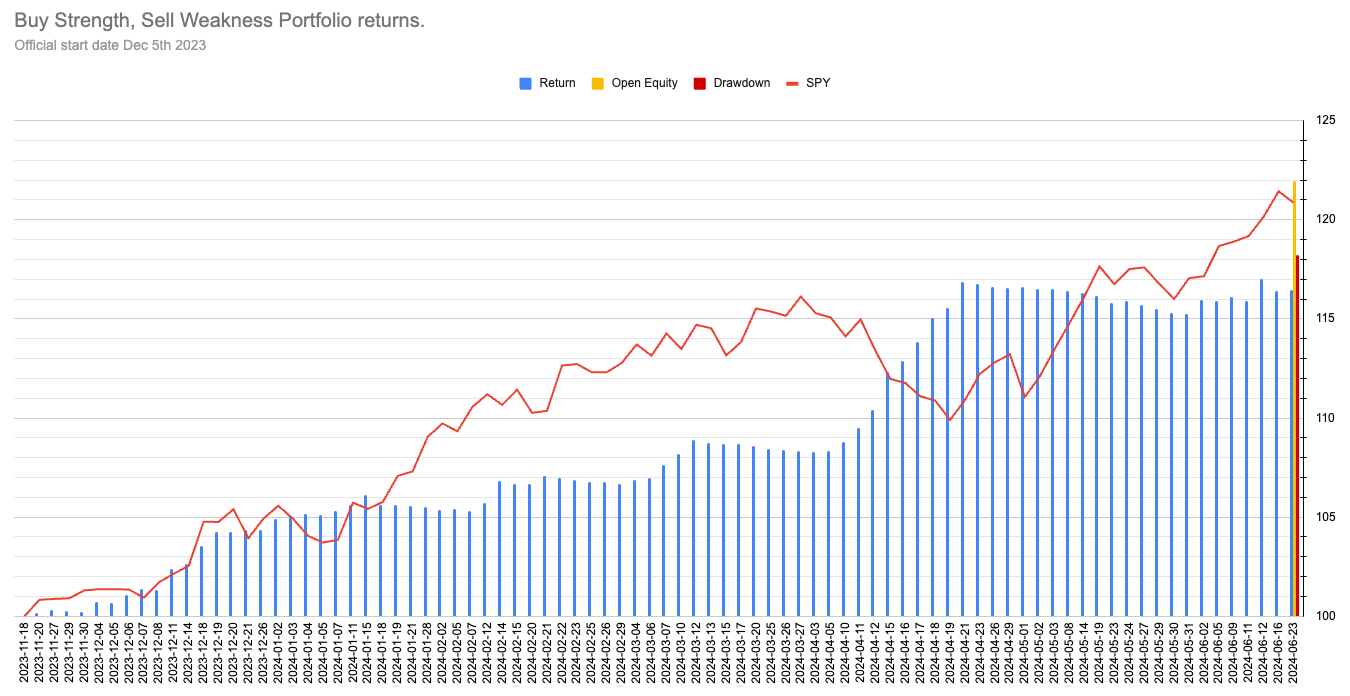
Open equity puts us +22% since we have begun this blog/stack/experiment.
If all stops are triggered our account value would be +18.2%.
Current portfolio positions coming into this week.
Hit the subscribe button to all the tickers, position sizes and stops.
Behind this fog of war, I construct a portfolio of the 50 stocks in the SP500 with high and rising signal strength. Free of any priors or bias I don’t care if Twitter says we are going into recession and my system is piling into high beta growth stocks. I have a system to get us out if we are wrong. It’s a game of percentages. It’s boring and often there is nothing to write about, but it beats trying to trade using stories that we tell each other.


