Predicting the Future, and Other Nonsense...
Week 35 - Weekly Equity Update
Onwards and upwards? Or more digestion?
Money flow is turning up.
I drew a green box on this here screenshot.
Here is my options adjusted seasonality chart for SPX price.
Here is the adjusted chart, where I have factored in the additional holiday periods this year, as well as the leap year.
I do not make predictions, but I have spoken in the past about the end of this year.
There is a common belief that we might see a repeat of 2016. Hedges get taken down post-election, and we’re off to the races, similar to what happened in 2017.
To clarify, I have taken the median return from the shaded blue area of the chart, transposed it onto current prices, and extended it into the future.
I am not predicting prices; I needed a future projection to calculate this next chart.
You may have heard me discuss past periods where what I define as trend convergence occurs.
This means that one price move can cross multiple timeframes of trend.
You can see this at the beginning of 2020 and again in late 2021. This is not a single point in time. You can see that the convergence in 2021 started on November 3rd and continued until January 18th, 2022.
As it stands today, keeping in mind that we are using approximations of seasonality, this puts us out to October 14th, 2024. If we go as far as 2021, we would be “converged” until the December OpEX.
I have no idea how this will play out, but it is a risk as we head into year-end.
What will be amusing, if this plays out anything like the past, is that we will see all sorts of narratives, stories, and data claiming to have predicted the policy error by JPow, along with numerous "famous" macro analysts who have been wrong for two years predicting a crash.
And you’ll know that it's all bollocks because it all came down to some random bloke in England noticing that two wiggly lines were touching.
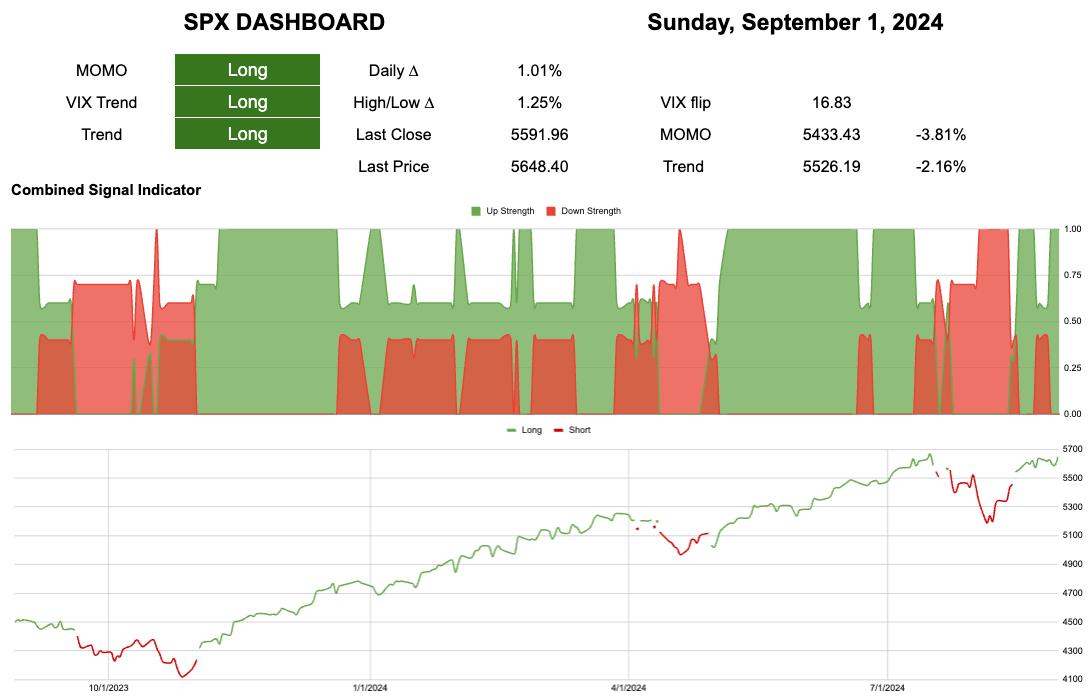
This scenario would align with my idea of a "bulls and bears confused blow-off." Currently, over 400 tickers in the S&P 500 are in a long position.
Current closed equity return = 21.6%
Current open equity = 29.6%
If all current positions close at stops our return = 24%


