
People Skip the Crescendo and Only Look for the Crash
Week 49 - Equity Portfolio Update

I highly recommend using the link to view these posts in a browser, preferably on a laptop or computer. Substack limits the size of emails, and since I use a lot of images, some readers have been missing important data by only viewing the truncated email.

5884 - 5932 is the line in the sand heading into next week.
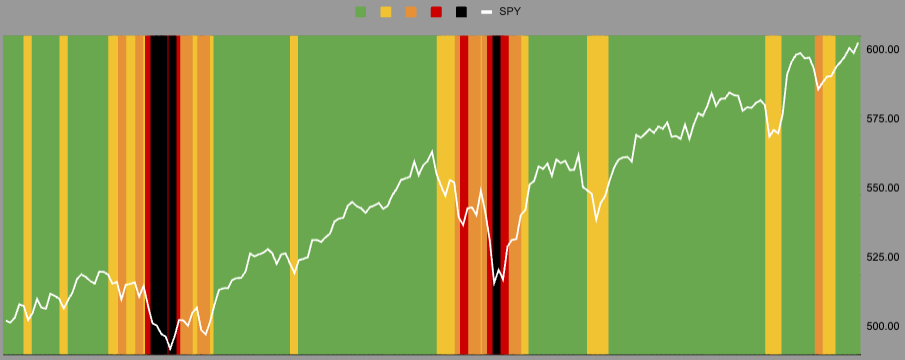

We remain in the green on the rainbow chart.
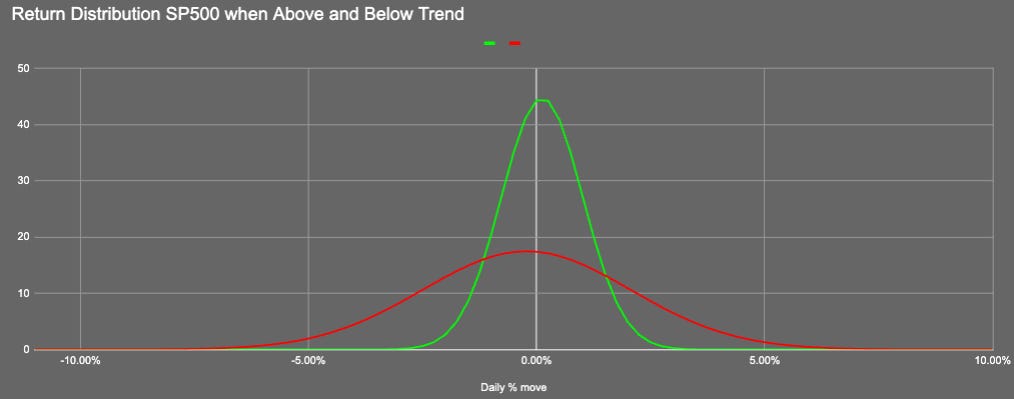
Importantly outside of the orange zone where we transition into the fat tail distribution curve.
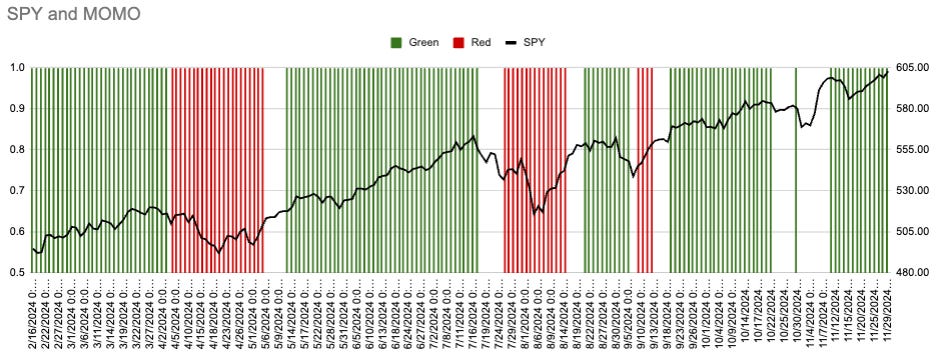
This chart shows we are in the green zone where short-term and long-term momentum is moving higher.

Strength of Signal levels across various timeframes.

This is the SPX seasonality chart linked not to months but OpEx dates. I have also time-shifted the chart to accommodate leap year, holidays etc.

Realised volatility has fallen significantly using a 3-month lookback. 1 month has plateaued for the last 3-4 weeks.
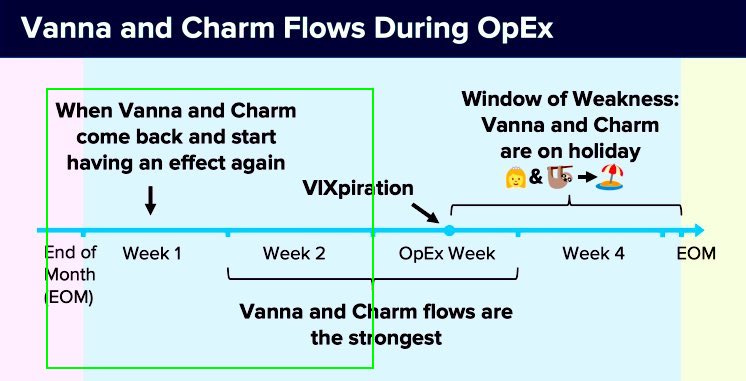
We now head into a period denoted by a green box so it is clearly bullish ;)

Current Open Equity = 37.9%
Stop Loss Trigger = 30.7%
Current Closed Equity Return = 28.1%
Our open equity outstanding is just shy of 38% since we started in Dec ‘23. We have been able to capture 28% returns in closed trades, meaning ~10% open equity still belongs to Mr Market. Until we close the trade it doesn’t yet belong to us!
If all our stop losses hit bar any gap risk we hope to close ~30.7%
Subscribe to see the portfolio. You can do it for free using the 7-day trial if you want.
And our current open positions:

Example of positions closing this week.

Please subscribe to see more of the portfolio we are constructing.
New user guide - Paid Portfolio Posts

Latest Hot Takes with Hank - I can talk faster than I can type! This is an unscripted stream-of-consciousness type babble while walking my dog. Random thoughts that are possibly helpful to maybe 3 people :)

Subscriber Discord
