Patience is a Virtue.
Week 53 - Equity Portfolio Update
I highly recommend using the link to view these posts in a browser, preferably on a laptop or computer. Substack limits the size of emails, and since I use a lot of images, some readers have been missing important data by only viewing the truncated email.
The line in the sand coming into a new week is ~5990. It's the same as it has been for a couple of weeks, except we’re below it.
Does it matter that we didn’t make a new high?
Then we have the Croissant Effect.
The big chart that started this whole experiment 4 years ago. Did we just fail to make a new high? Or will the compression continue into the new year and beyond?
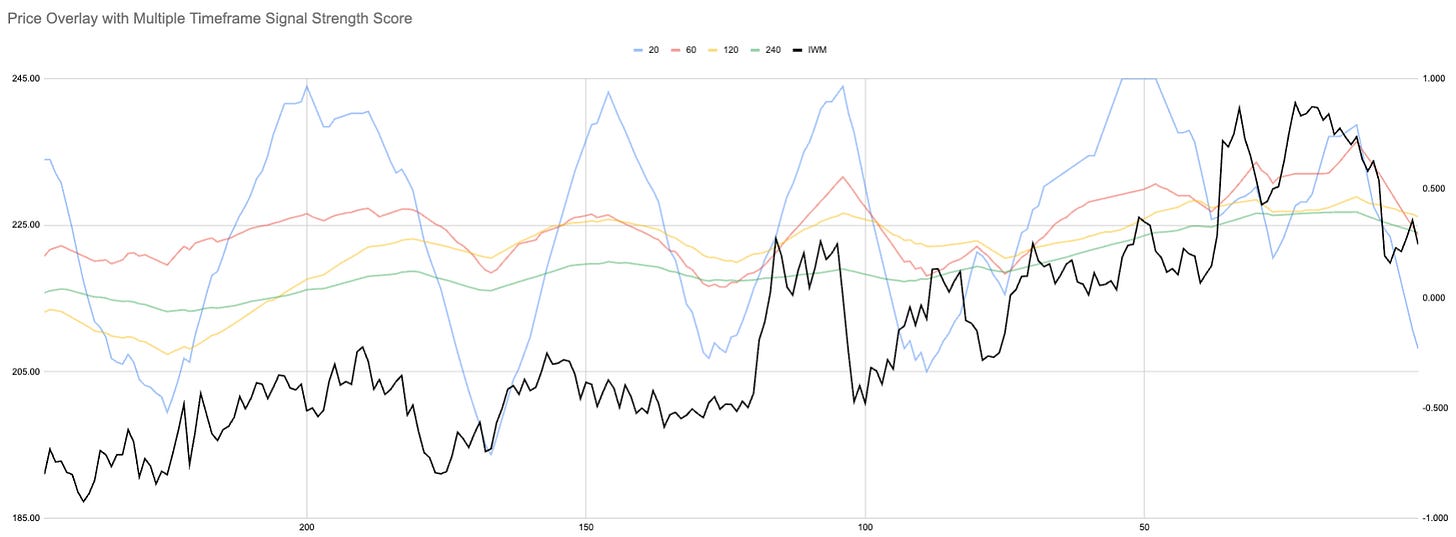
I want to highlight the very different “signature” between IWM and QQQ. IWMy is defined by mean reversion and QQQy by trend.
You can see that SPY has not made a new high since IWM peaked despite the mega cap move.
Current Open Equity = 34.7%
Stop Loss Trigger = 33.3%
Current Closed Equity Return = 30.9%
Our open equity outstanding is ~35% since we started in Dec ‘23. We have been able to capture ~31% returns in closed trades, meaning ~4% open equity still belongs to Mr Market. Until we close the trade it doesn’t yet belong to us!
If all our stop losses hit bar any gap risk we hope to close ~33%
Subscribe to see the portfolio. You can do it for free using the 7-day trial if you want.
And our current open positions:
Please subscribe to see more of the portfolio we are constructing.
New user guide - Paid Portfolio Posts
Hot Takes with Hank
Subscriber Discord


