
Onwards and Upwards...?
Intra-Week Update Xmas Special

I highly recommend using the link to view these posts in a browser, preferably on a laptop or computer. Substack limits the size of emails, and since I use a lot of images, some readers have been missing important data by only viewing the truncated email.
Be honest!!!
Who has not been long all year or in fact for 2 years and immediately was
“f*** yeah buy the dip!”
Did anyone else notice Dave Rosenberg is no longer bearish?
Is that worrying?
Imagine when a dip isn’t dip…
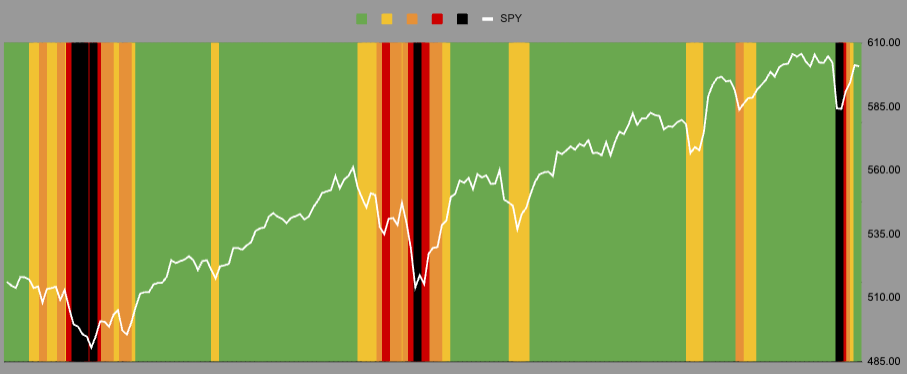

Look at the damage that needed to be done in April and August to get to the same pain level.
This is why we have to “de-trend” the prices. These levels are not price levels.
April -5.2%
August -7.2%
December -3.8%
As I have explained before old prices are just as important as new. Old prices leaving affect the calculation just as much as the new ones.
At some point in the future we will hit the “black line of doom” and not immediately regain trend.
Until then perhaps it’s time to dance a little closer to the door.

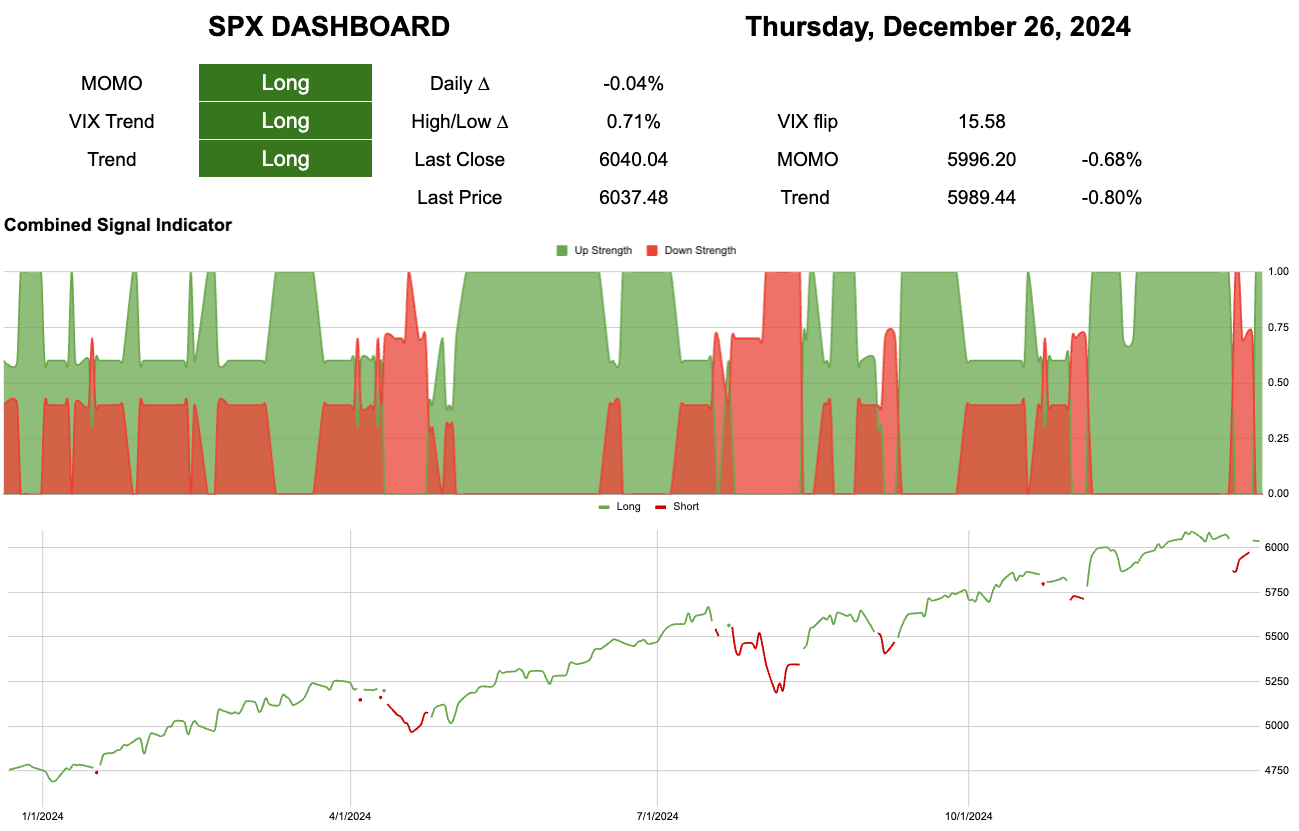
Current Open Equity = 34.3%
Stop Loss Trigger = 32.9%
Current Closed Equity Return = 30.9%
Our open equity outstanding is ~34% since we started in Dec ‘23. We have been able to capture ~31% returns in closed trades, meaning ~3% open equity still belongs to Mr Market. Until we close the trade it doesn’t yet belong to us!
If all our stop losses hit bar any gap risk we hope to close ~33%
Subscribe to see the portfolio. You can do it for free using the 7-day trial if you want.
Please subscribe to see more of the portfolio we are constructing.
New user guide - Paid Portfolio Posts

Subscriber Discord
