Just Keep Swimming mkV
Friday 7th June - Daily Equity Update
🐠 = just keep swimming
Daft charts day.
Do not transpose one action on another. Its easy but it often doesn’t help.
In some of my old videos, I often bucketed things in the SPY into is it QQQy or IWMy.
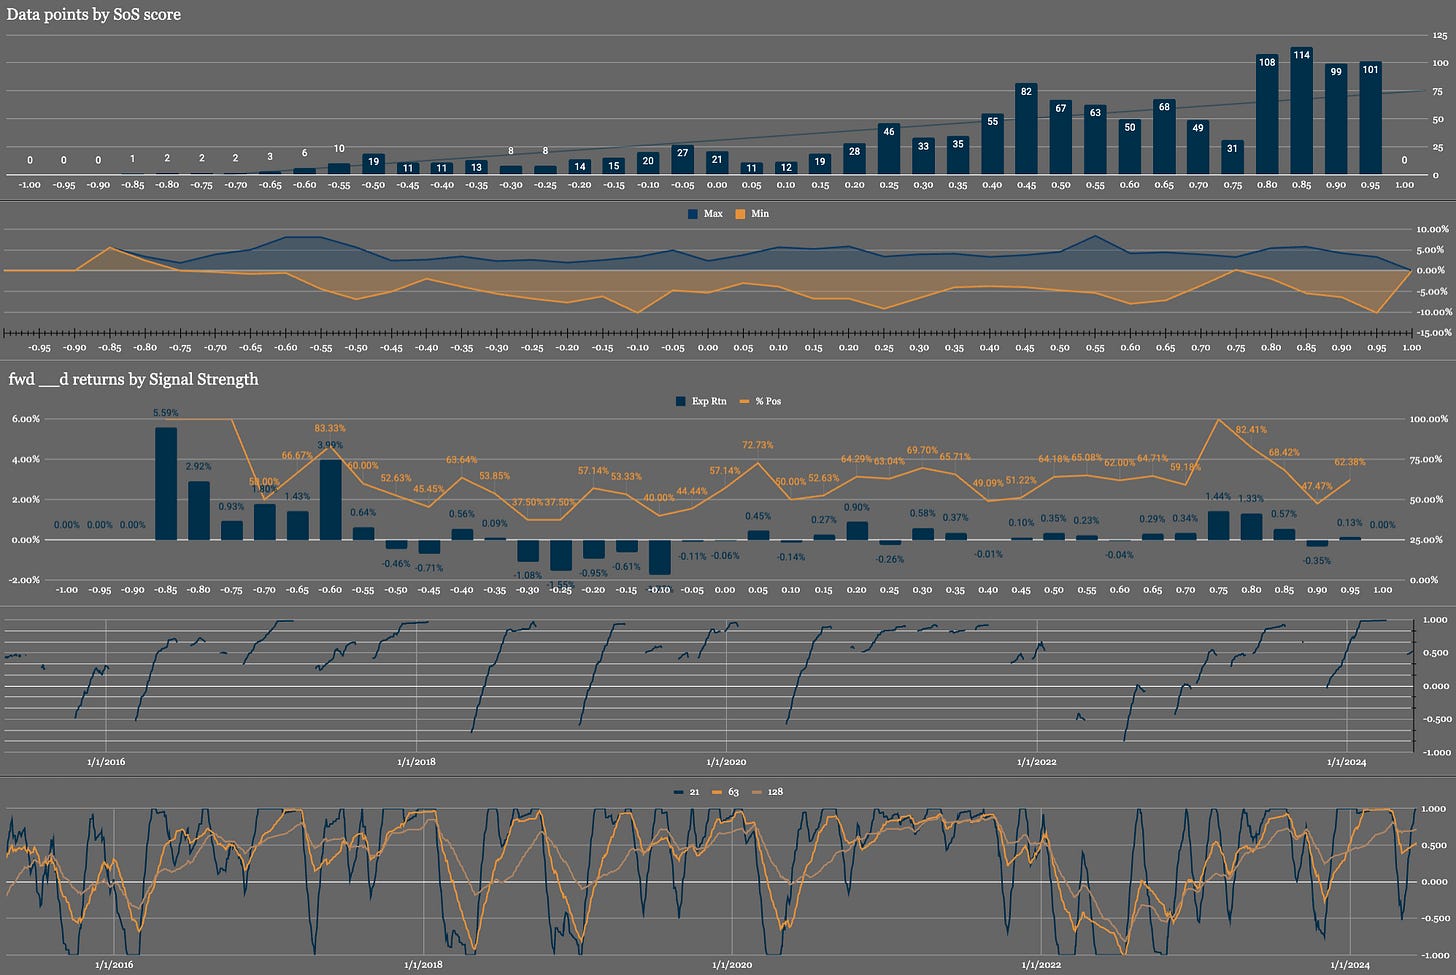
Interesting chart that some may remember. Is it useful? I am not so sure. Its very pretty and would probably get attention on twitter but I have moved on from this and systematised a specific set of triggers.
So all these data points are using the 63day / 3 month Strength of Signal (orange line bottom chart) measure when it is in an uptrend (blue line 2nd bottom chart).
The current score is 0.533 which puts us on the right hand side of the middle chart. 30day forward returns are relatively low but that is just as much a function of the top chart, where we have more data points to average. But the %Pos is in the high 50s or higher which is good.
The top chart is important. “If” we continue in an uptrend we are more likely to remain in an uptrend.
Duh Chris!!
SPX is a gift that keeps on giving. SPX likes living life up here look at where the data points cluster in the top chart.
If we go into a downtrend of course this all changes.
But!
We have to break momentum and trend before entering a downtrend.
That means 5281 and 5227.
TLDR
Just keep swimming.
Open equity currently puts the return at 22.3% and 18% if all stops trigger at current levels. Importantly the volatility is very low. April is a great example while many are freaking out we are capturing gains and preparing for the next move to come.


