Just Bear With Me.
Wow 40 days is a long time.
For someone who doesn’t listen to or watch "the news," I seem to comment on it quite a lot.
I’ve curated a collection mainly of podcasts and a few YouTube channels that give me broad coverage. While listening, I can find myself shouting at the hosts and calling them all sorts of names. Like nails on a chalkboard, I take a break and return for more.
Why?
Some of these sources have huge subscriber bases, and while I rarely find them useful, what is helpful is seeing what a large portion of the investing audience is consuming. Many of those on my list have been hugely helpful in getting me to where I am today with my process.
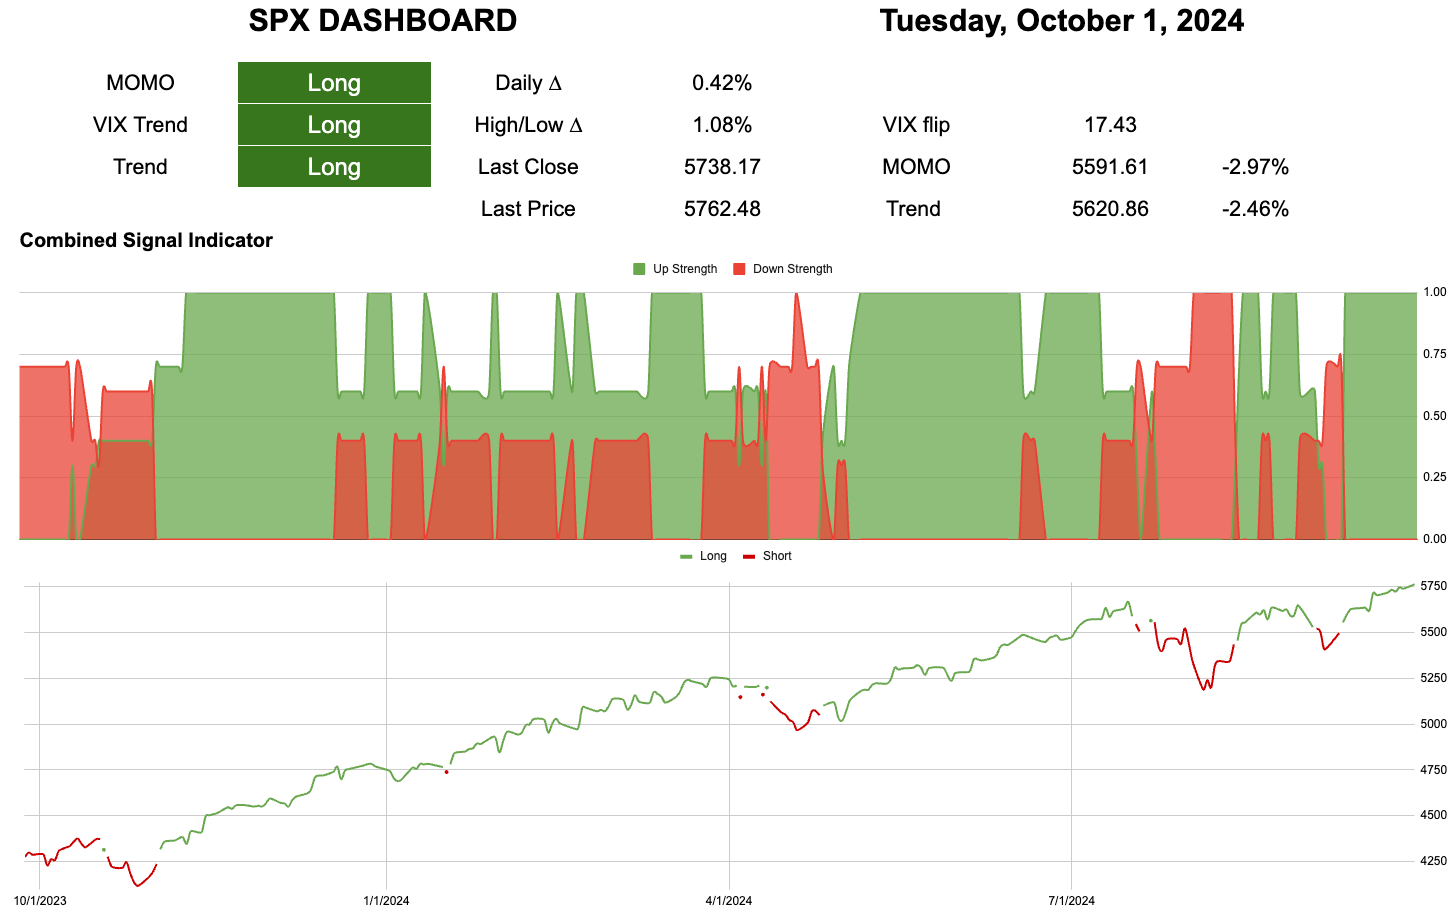
The chart above is "max green."
My portfolio is fully long, and I’ve begun rotating into high-beta stocks.
Does anyone else sense the complete change from 40 days ago, when the VIX was almost in the 40s?
My system figures these things out much better than I do, and as I mentioned, it’s "max green."
If everyone was so wrong 40 days ago, what are the odds they're correct now?
I will jump straight to the teeny tiny wiggles today.
I don’t really trade intra-day because, frankly, I’m just not very good at it. Last week, I pointed out the convergence around 570 across multiple timeframes. For now, it seems like we’ve hit it.
The breakout reaction was extreme, moving from -4 to over +4. As a result, the "bands" on the five-minute measure no longer look like bands at all.
Small steps. After Monthly OpEx yesterday, a large magnet for price has been removed. The reaction was strong, but now price is free to move in either direction.
New Subscriber Intro
This is the first attempt to make a subscriber intro. New and potential paid subscribers can have a look behind the paywall of the weekend portfolio posts.
New/potential subscriber intro video. It shows the weekend posts and charts that are included.
Current Closed Equity Return = 23.4%
Current Open Equity = 31.5%
Stop Loss Trigger = 25.7%


