
If a Bear Hedges in the Woods...
...but Nobody Is There to Hear It...

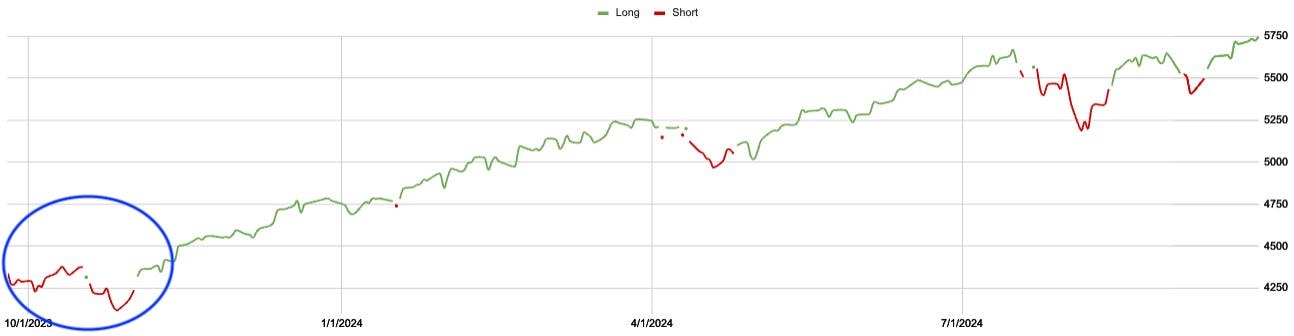
I spoke about old data yesterday, and there’s a reason the charts above are as long as they are.
Remember last Halloween when we were supposedly heading into the 7th recession in two years? Remember when the Piper had to be paid?
Well, now all of that has to disappear.
Over the last 2-3 days, I’ve listened to what I believe is a broad basket of podcasts. This morning, I had to delete 4-5 more because they were all saying the same thing.
Growth is slowing but remains resilient; inflation may have bottomed in the US but has already started to rise in Europe.
Of course, every guest began or ended the conversation with, “I don’t think this view is consensus.”
I wonder how many total listens those 10-12 podcasts have? I also wonder what the AUM is under management by those listeners.
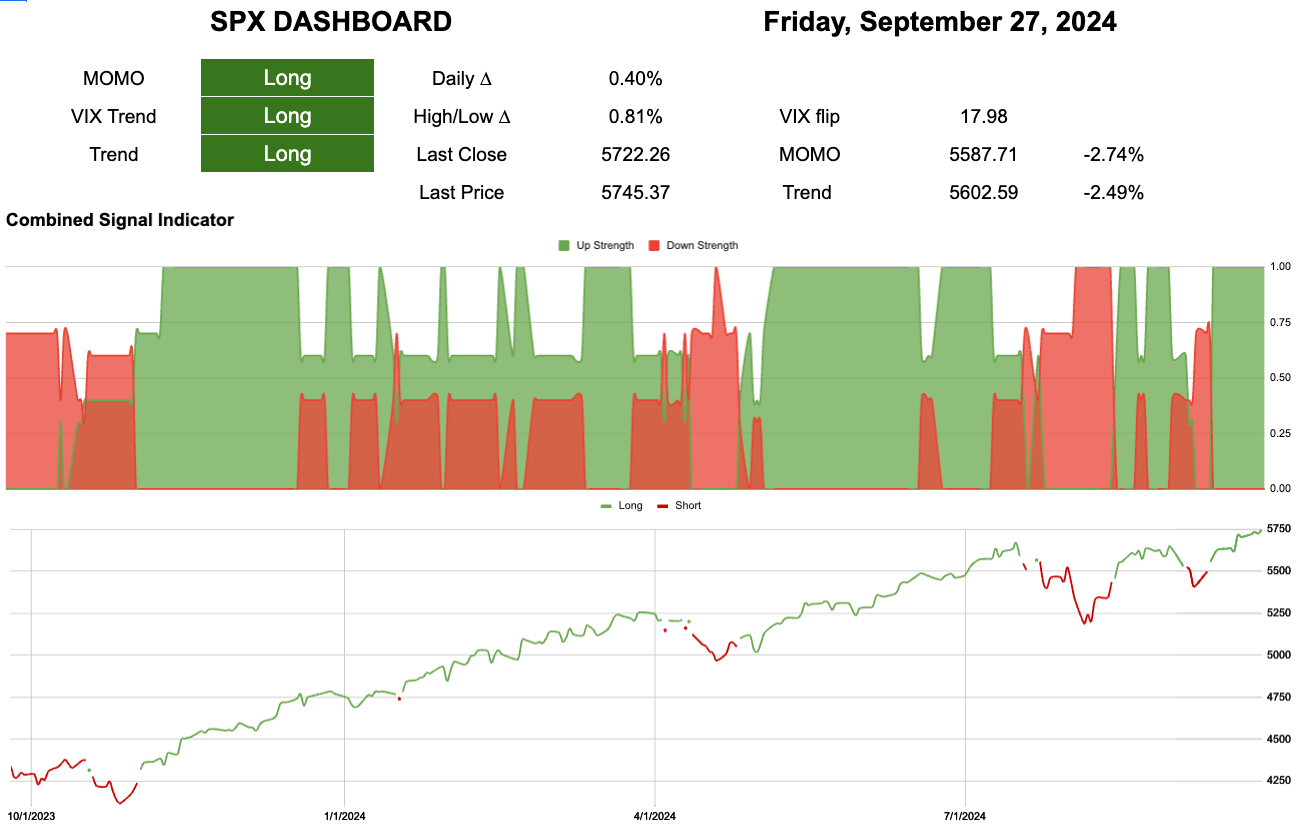
For almost two months, I’ve been saying we’re heading into—or are already in—crazy market conditions.
5587-5602 is today’s line in the sand.
Notice how they keep moving.
If we go on some crazy run to 6000, rising prices are never a signal to short. The signal is to get out, and paradoxically, the higher it goes—especially once October passes—the “lines in the sand” get closer and closer to whatever the “current” price is.

Chris, why is the old Hourly line now above the Daily?
Because volatility has fallen, and because volatility has fallen it changes time. Meaning it now has a different amount of Hourly data points to look at. Nothing is static! It is constantly moving.
Just because something made an All-Time High 50 days ago if the lookback is currently 20 days that ATH doesn’t exist for that timeframe.

Open Equity = 31%
Stop Loss Potential = 25.2%
Closed equity Return = 22.9%

