Fractals all the way down...
Wednesday 24th April - Daily Equity Update
I think by now most of you know I have disdain for “news”. Many wrongly attribute that conflict has softened so markets have gone up. I would say markets have gone up so there is no longer an incentive to write about conflict.
Anywho..
I write about closing daily prices. That doesn’t mean that I don’t “have a nosey” at the other timeframes.
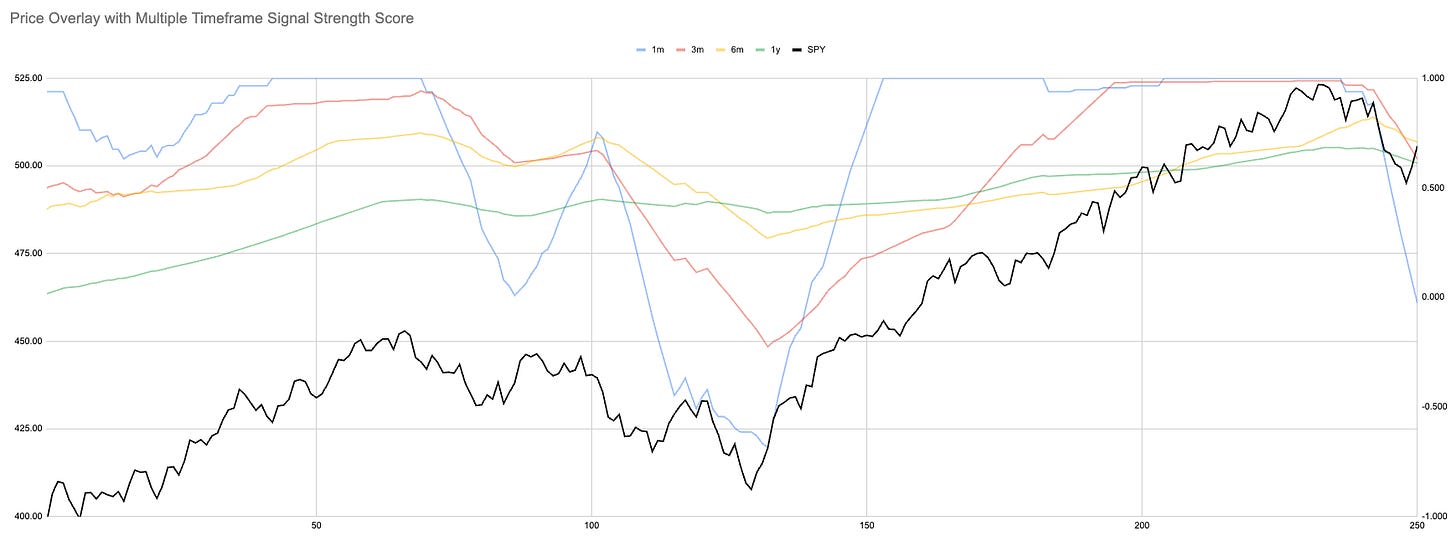
Here is the hourly chart of SPY. As per today’s title, the output of the system looks exactly the same no matter the timeframe.
Does this mean we have bottomed? Maybe.
Here it is on the 5-minute chart. Does this mean we’ve topped? Maybe.
Surely this one means we’ve topped? Maybe.
The point I am attempting to make here is I have a system, and that system on only one ticker paints three pictures. Now add 500 more in the SPX plus 100 macro ETFs and 200 currency pairs. I chose these three because I have shared them before but I can paint 17 pictures for every ticker.
Now layer on to that:
“They are manipulating the data”
“stocks will do well because…”
“With President X sector Y will have these tailwinds due to these 3rd order effects”
“War”
“Peace”
“Weren’t wrong yesterday when we said peace but definitely war again”
“AI”
“oh now not AI because of energy”
Blah Blah Blah.
I will stick to my nice and simple 17 * 500 = 8500 pictures thank you.
The most important over-arching picture if you will, is the one that says when SPX is above momentum and trend it goes up 78% of the time.
Until then I will try and ignore the news and play with my fractals.
This thing could go to 5131 and then sell off to 4885. Reset everything on a momentum basis and be on its way 6000.
Small steps. Has to turn these red things green first.


