Does "The News" matter?
Thursday 18th April - Daily Equity Update
Yesterday I replied to a tweet asking about sources of news.
I lean in a certain direction of course but as ever the answer is often somewhere in the middle.
Don’t want to keep repeating it so I will say at the outset was any individual news item important not to society but to markets?
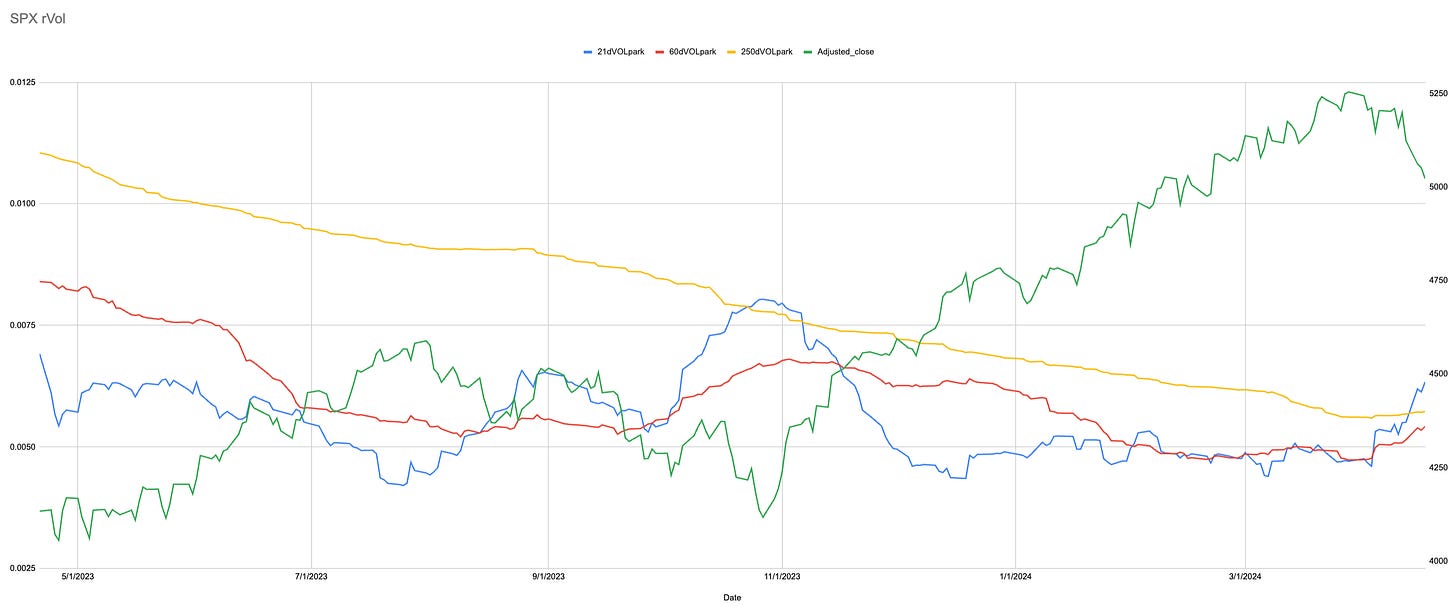
SPX realized volatility one month has been flirting with three months all year. This is the first time one year has been crossed since October ‘23.
Low volatility in a lookback means the hurdle needed to break it is naturally lower.
Have the daily moves in this weak period been large? A couple of them have but overall the rise in the daily average has been driven by the vast amount of small daily moves that still appear in the lookback window.
Now this is a messy chart but again as volatility has fallen the levels that define momentum squeeze and contract. This makes them easier to break.
Broken record I know blah blah stability breeds instability. Get to the point!
The point I am trying to make is to have a look back over the last 6 months at any number of “important” pieces of news. If it didn’t garner a market move it has probably long been forgotten.
Again removing any social damage and in no way is my intention to diminish any suffering.
The Fed the attacks in the Middle East are now elevated to have meaning for the market because a market move occurred.
Did one cause the other? Who knows?
The difference is that they occurred during a period when it was far easier to cause a market move due to the underlying structure.
That is something we have been discussing here for a long time.
VIX expiry is behind us equity expiry is on Friday we know that options drive price so as ever these are important.
Let’s see how it goes.
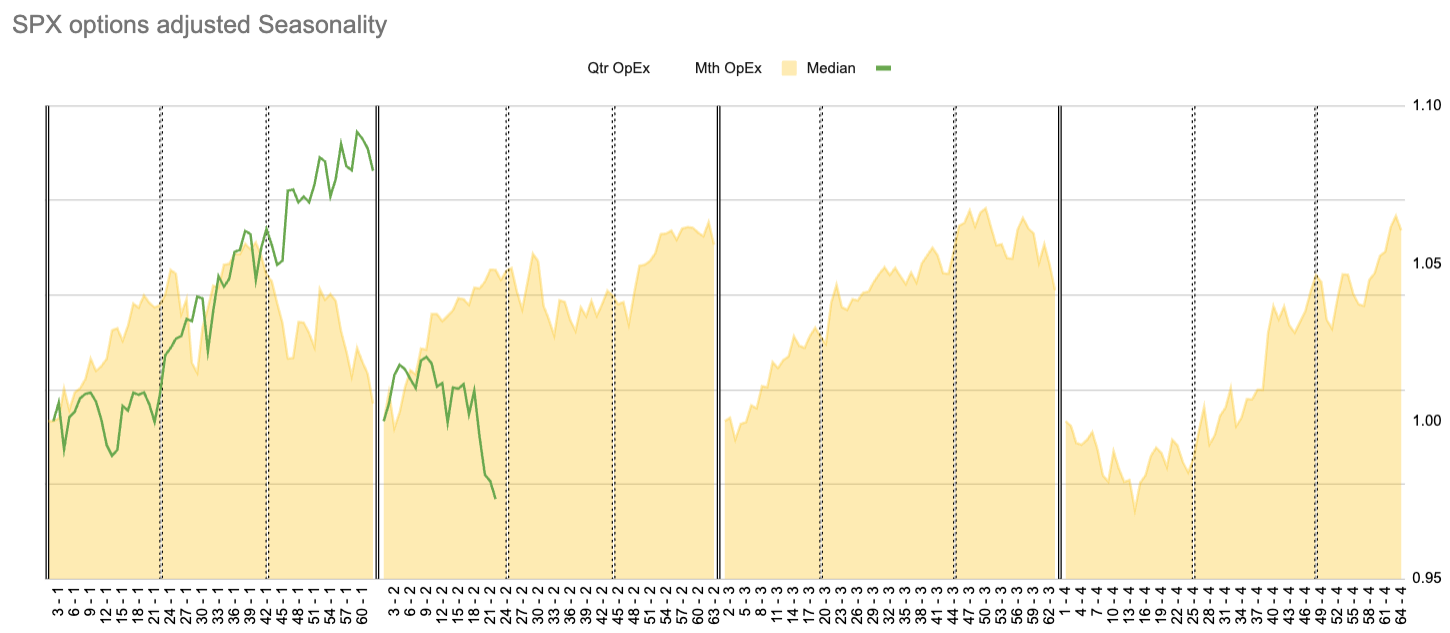
Is seasonality still a thing? It appears all the people previously sharing charts about it must be on vacation.
This isn’t just an index thing all measures for individual stocks were compressed making them easier to break no matter what the trigger was.
Reduce : Half WAB
       : Cash PH ETN AME HCA ZBRA TXN
3M Strength Horizontal ← Use this link to find the Sub-Sector breakdown of signal strength.
1M/3M MOMO ← Use this link to find the stock’s positions relative to 1M + 3M momentum.
MOMO/TREND ← Use this link to find the stock’s positions relative to momentum and trend.
The data has been updated. Call this my markets in turmoil update. Normally these charts only get updated on the weekends.


