Dips, Slides, and the Black Line of Doom: A Data-Driven Look at the S&P 500’s Next Moves
Week 48 - Equity Portfolio Update
I highly recommend using the link to view these posts in a browser, preferably on a laptop or computer. Substack limits the size of emails, and since I use a lot of images, some readers have been missing important data by only viewing the truncated email.
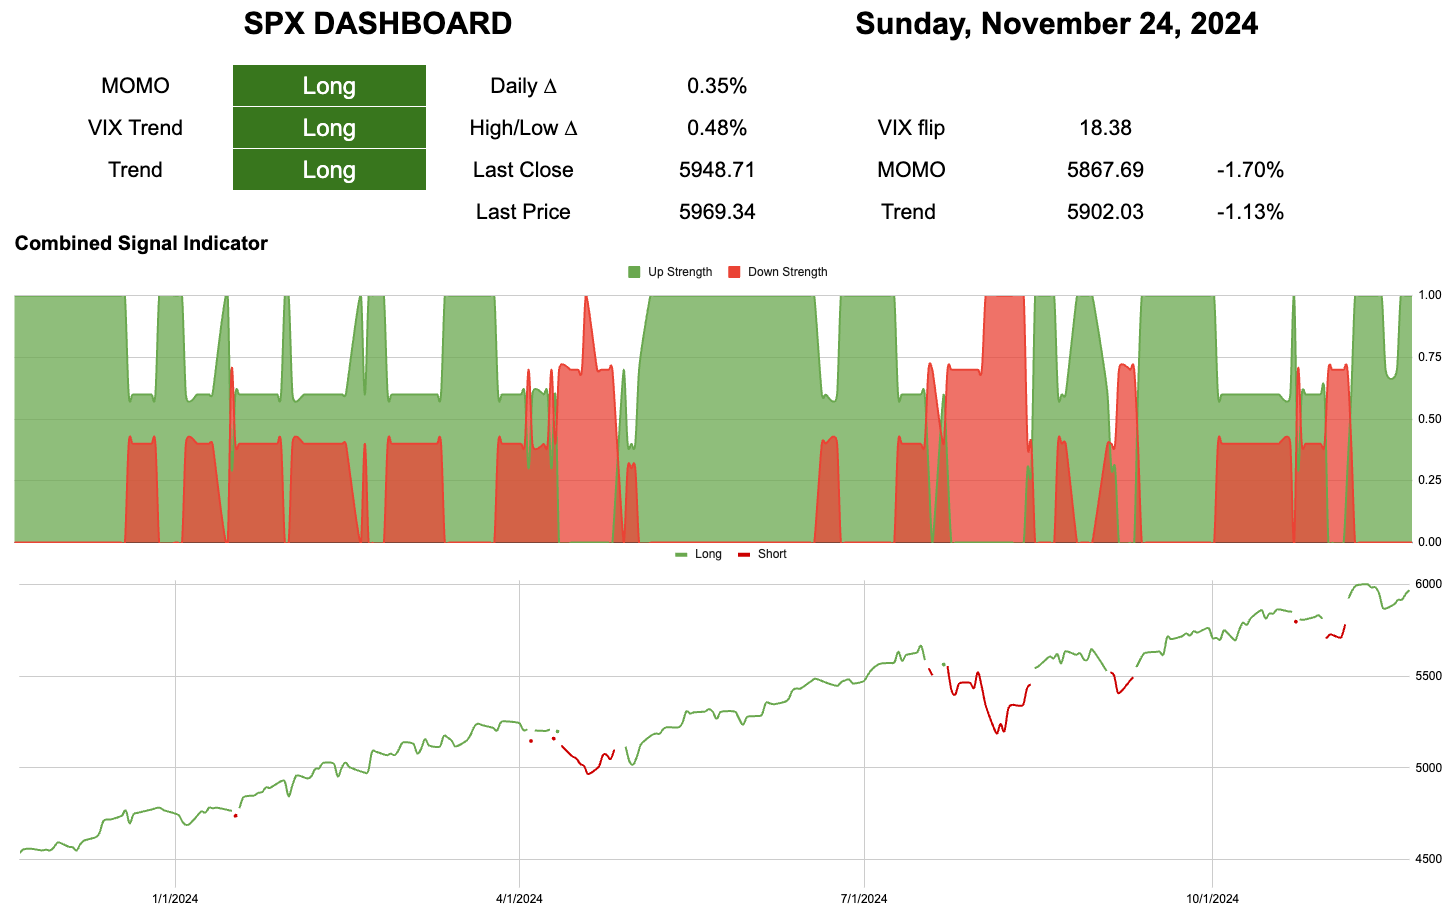
5867–5902 is now the line in the sand at the top layer index level.
Any information provided here about the index is solely intended as an aid to trade the portfolio!
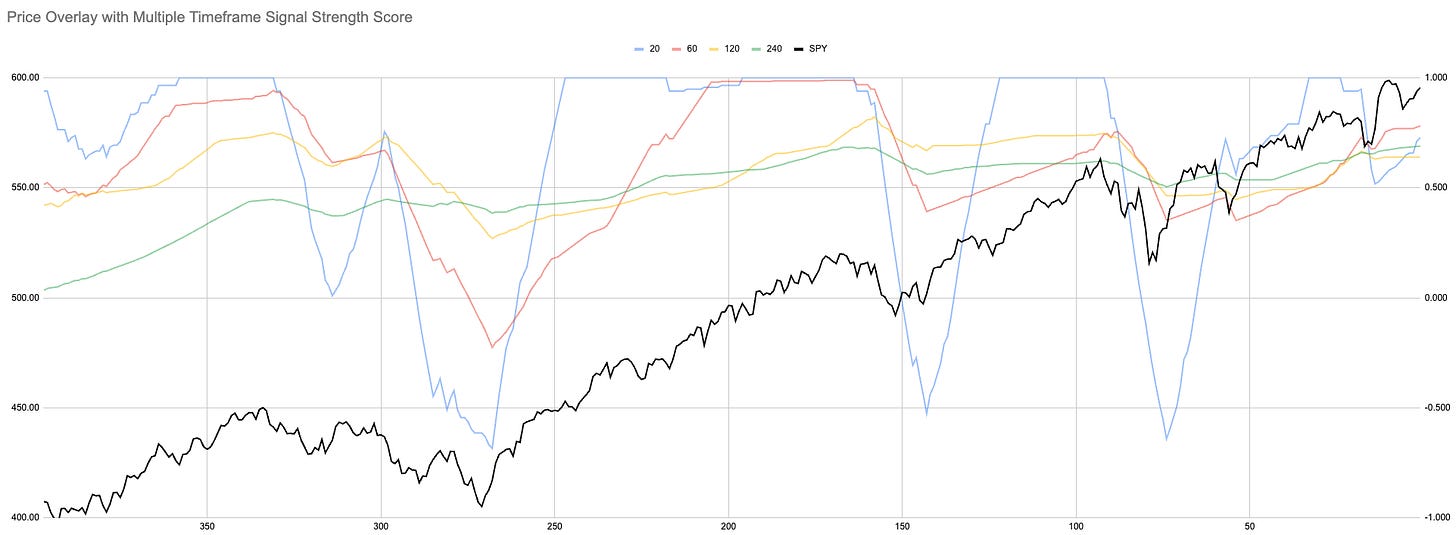
Signal strength has turned up again on the 1-minute (20) and 3-minute (60) timeframes. However, longer-term trends can be a little stubborn.
Momentum remains on the upside, but we have not had a major buy signal since August.
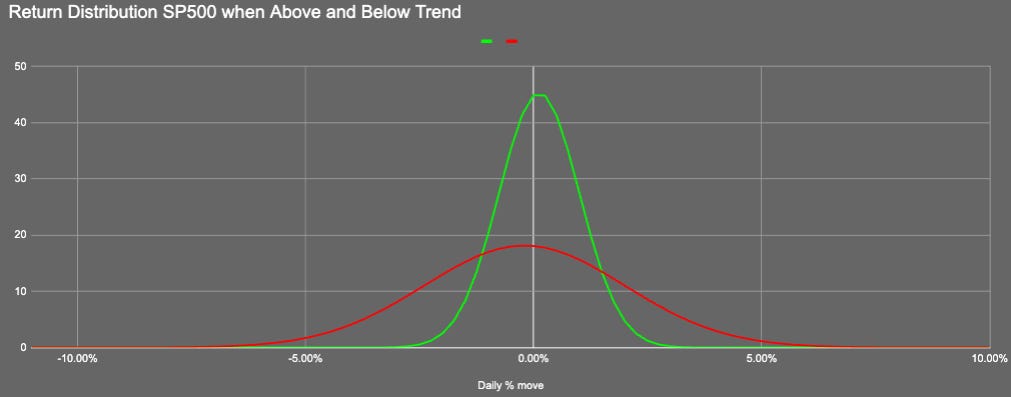
We are back to green. Below is why the second trend line is so important:
Once we break the second trend, the return distribution shifts to a level where we don’t want to be fully invested.
Of course, I perform these types of calculations for every stock in the S&P 500. Just because the index breaks doesn’t mean there won’t be individual stocks to remain long on.
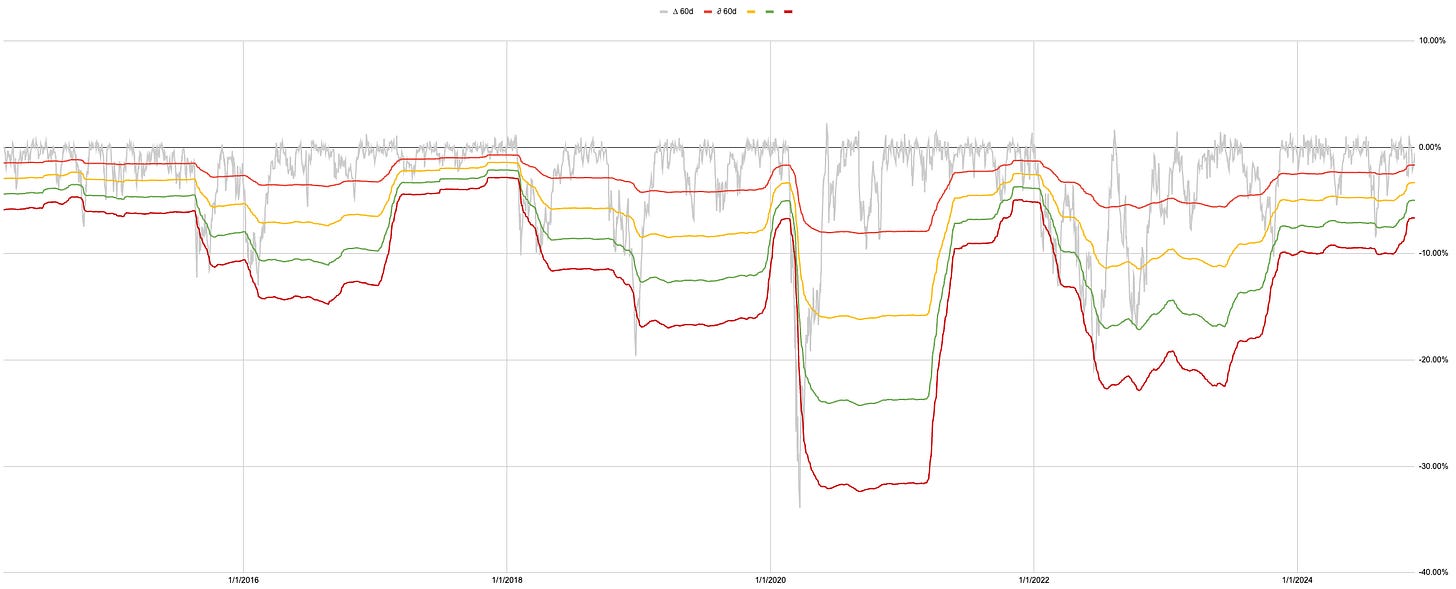
This is not a "freakout" post; as always, it’s about maintaining balance. At this longer timeframe, a -6.7% move from the highs would push us into the "black line of doom" for this timeframe. Less than three weeks ago, it would have taken a -10% move.
If the S&P 500 breaks to new highs, this -6.7% threshold will shrink (or rise, depending on how you describe it). Essentially, it becomes easier to hit.
We’re now in a period until mid-January where old prices will have less impact on these levels.
Until around December 8th, the lower level won’t move much, following a big rise from dropping last Halloween from the look-back window.
We are closer than we’ve been in a long time to a point where dips should be evaluated carefully rather than blindly bought. This is where people risk getting caught off guard. Many have finally entered the market under the assumption that "uncertainty" is behind us or that there’s been a political shift in sentiment.
This is not the case.
This doesn’t mean to go short or move entirely to cash! It just means the easy gains have likely been captured. All the dips have been bought, so those who haven’t benefited from previous runs might end up buying the dips that turn into slides.
As always, we only watch the data!
Current Open Equity = 36.6%
Stop Loss Trigger = 28.7%
Current Closed Equity Return = 25.3%
Our open equity outstanding is over 36% since we started in Dec ‘23. We have been able to capture 25% returns in closed trades, meaning ~11% open equity still belongs to Mr Market. Until we close the trade it doesn’t yet belong to us!
If all our stop losses hit today bar any gap risk we hope to close ~28.7%
Subscribe to see the portfolio. You can do it for free using the 7-day trial if you want.
And our current open positions:
Please subscribe to see more of the portfolio we are constructing.
New user guide - Paid Portfolio Posts
Latest Hot Takes with Hank - I can talk faster than I can type! This is an unscripted stream-of-consciousness type babble while walking my dog. Random thoughts that are possibly helpful to maybe 3 people :)
Subscriber Discord


