
All Red Leaves start Green.
Week 06 - Equity Portfolio Update

I highly recommend using the link to view these posts in a desktop browser. Substack limits the size of emails, and since I use a lot of images, some readers have been missing important data by only viewing the truncated email.

The flip-flopping continues.
We are back above Trend (6015) and Momentum (5980) but it can be a dicey place when they are inverted like this.
Daily timeframe:

Strength of Signal has risen but here is the conundrum, is it “good” when the bad days in the score calculation are just replaced with less bad days?
Does it matter? Well I would much rather bad count replaced by good count across the board.
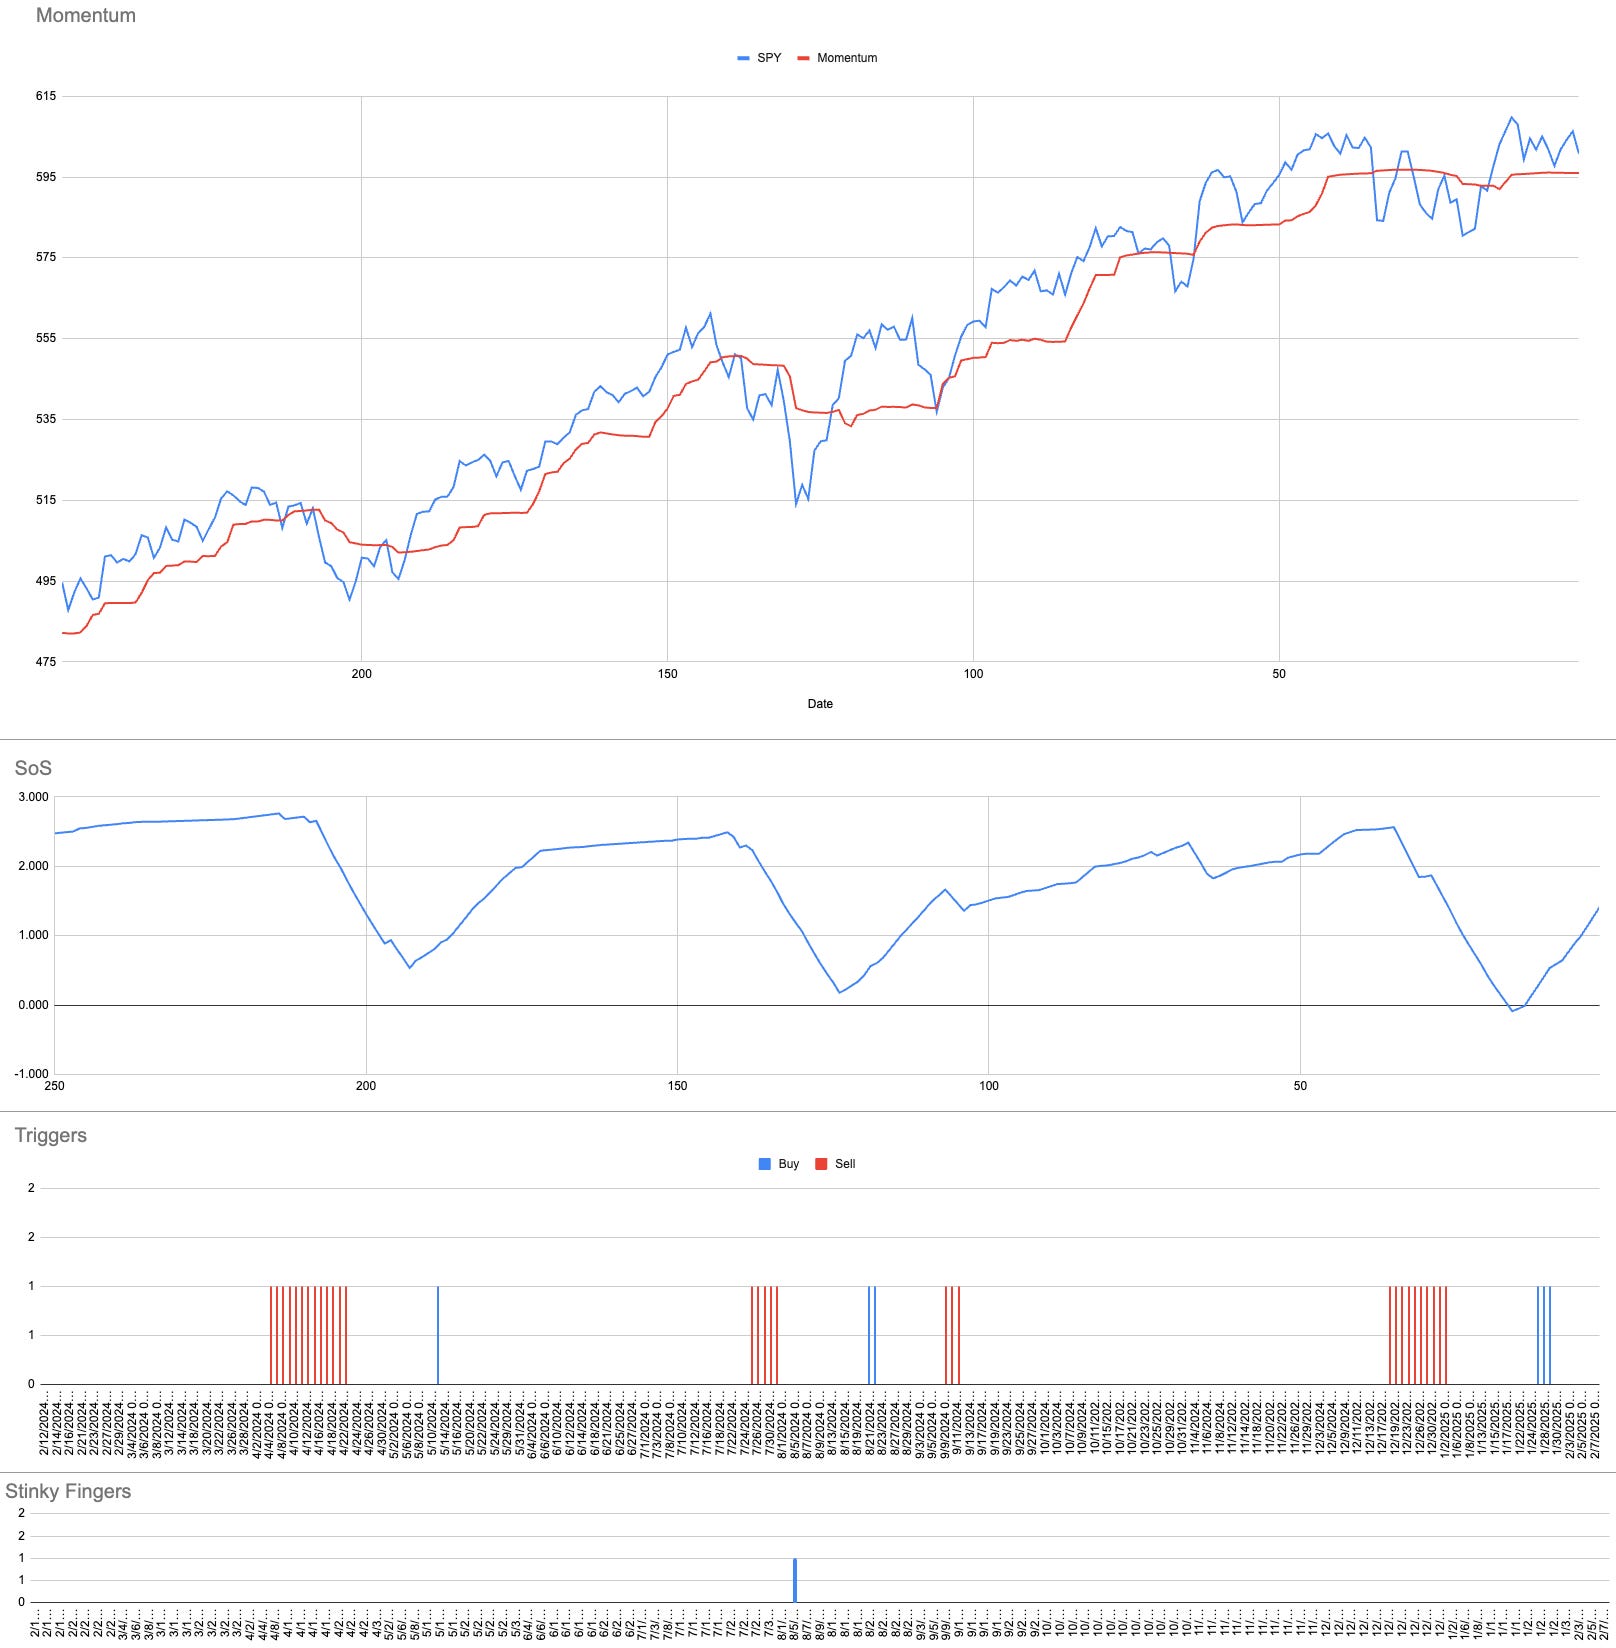
I have said many times these triggers are more meaningful in pairs. Will we get another bite?

The bands are contracting slowly on the shorter timeframes.

Nobody knows the future the only way is to measure the past and build some guide rails. This is one of them. Forget all the news and third-order thinking that so few of us can do. When our guide rails are green we do green things.


I guess despite all the green lights sometimes the big boys are all that matters.
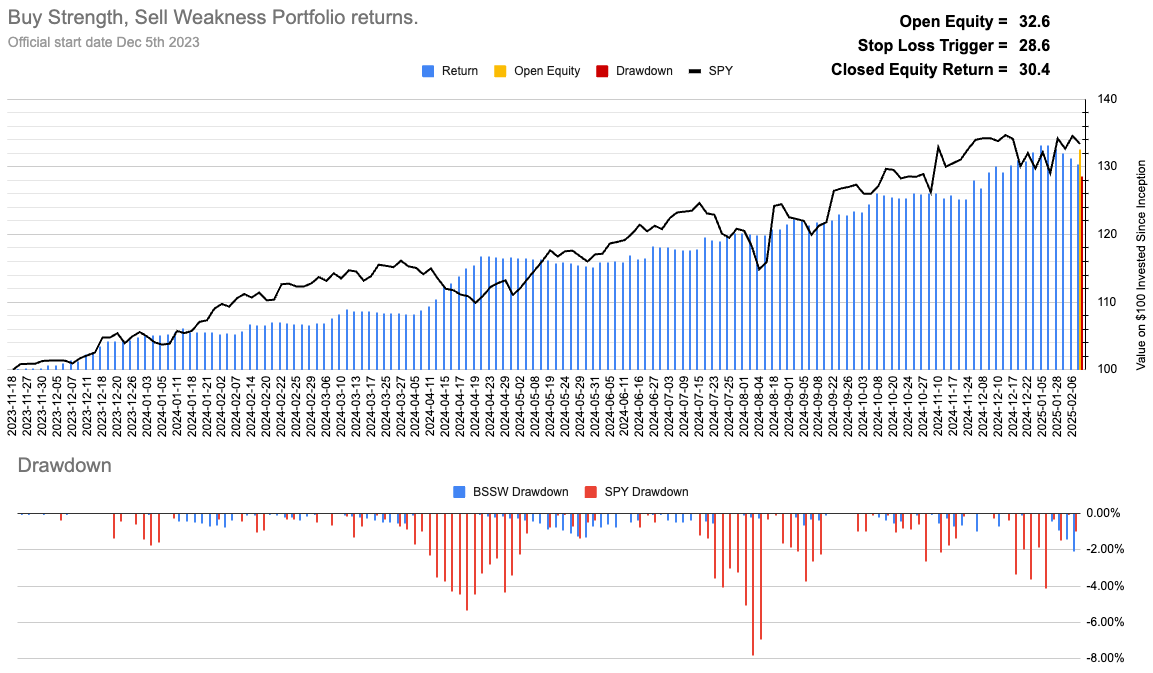
Current Open Equity = 32.6%
Stop Loss Trigger = 28.6%
Current Closed Equity Return = 30.4%
Our open equity outstanding is ~33% since we started in Dec ‘23. We have been able to capture ~30% returns in closed trades, meaning ~3% open equity still belongs to Mr Market. Until we close the trade it doesn’t yet belong to us!
If all our stop losses hit bar any gap risk we hope to close ~28%
It cannot always be rosy! There is no free lunch we have to risk losing to be in the game to win. We could have a -2% drawdown.
Subscribe to see the portfolio. You can do it for free using the 7-day trial if you want.
And our current open positions:

Please subscribe to see more of the portfolio we are constructing.
New user guide - Paid Portfolio Posts

Hot Takes with Hank

Subscriber Discord
